

In this simple Tutorial we will walk through enabling the new DSE Metrics Collector demo using a DataStax Enterprise (DSE) 6.7 Docker Container, exporting the metrics to a Prometheus Docker Container and visualizing these metrics using a Grafana Docker container.
This demo creates a DSE 6.7.0, Prometheus 2.4.3 and Grafana 5.3.2 container.
Prerequisites
- A computer running MacOSX, Linux or a Linux Virtual Machine
- Basic understanding of Docker images and containers.
- Docker installed on your local system, see Docker Installation Instructions.
- Docker Compose installed, if running linux see Install Docker Compose
- DataStax DSE Docker Images are hosted on Docker Hub. For documentation including configuration options, environment variables, and compose examples head over to our official Docker Docs
Getting Started
To run this demo we need to first get the demo data, we do this by cloning the DataStax DSE Metrics Reporter GitHub repo with the following command
curl -Lo dse-metric-reporter-dashboards-master.zip https://github.com/datastax/dse-metric-reporter-dashboards/archive/master.zip && unzip dse-metric-reporter-dashboards-master.zip
Now we need to cd to the demo directory
cd dse-metric-reporter-dashboards-master/demo
Starting the Containers
Next start the containers with docker-compose using the downloaded docker-compose.yaml
docker-compose up -d
The docker-compose.yml
- Pulls the images from Docker Hub
- Creates a bridged network for the containers to communicate on
- Maps the volumes to containers with the files we downloaded
- Publishes the ports for insights, prometheus and grafana
- Creates an alias for the dse container to use as the address in our custom
tg_dse.json`
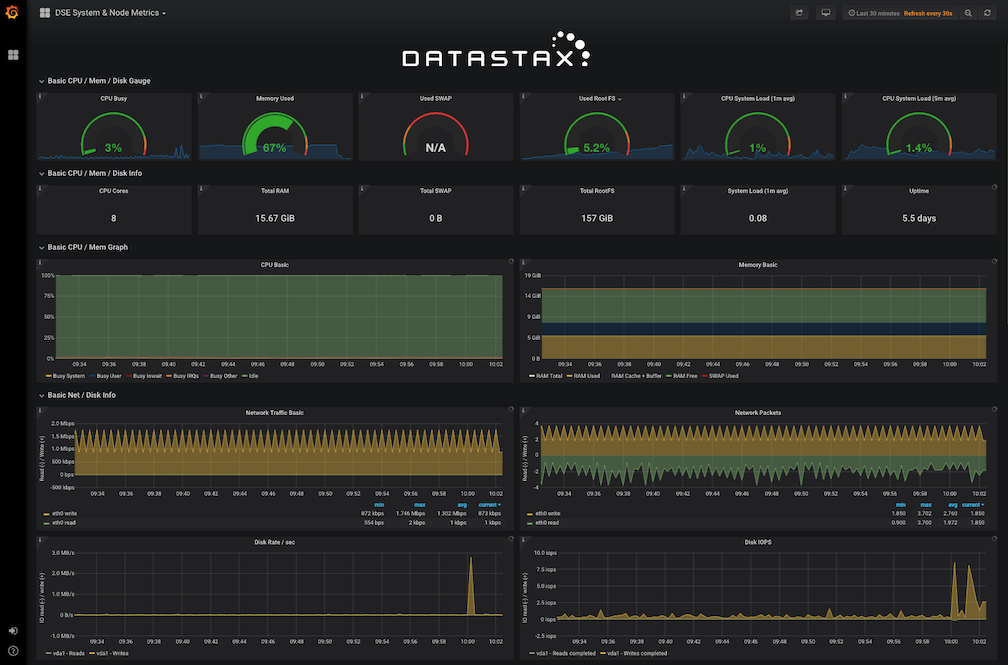
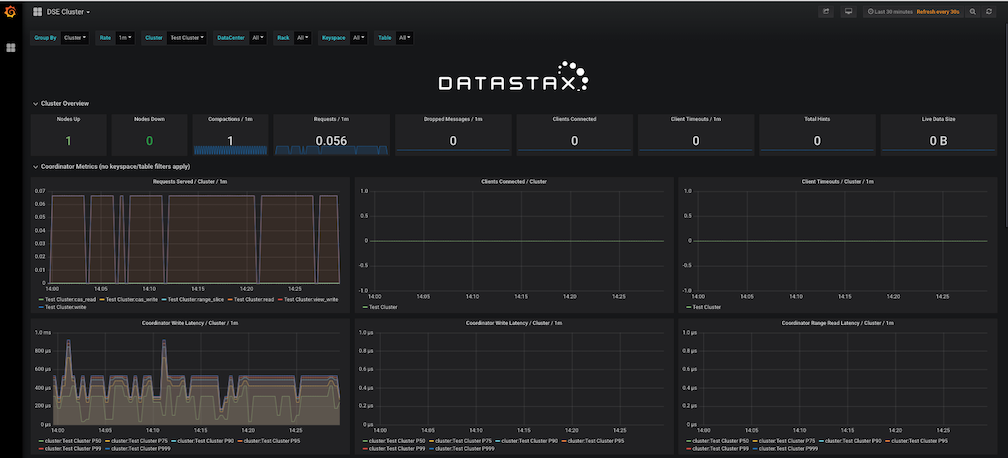
Viewing the Metrics in Grafana
It can take a couple of minutes for DSE to completely start and metrics to begin populating. Visit the following link to view the metrics using the provided Grafana dashboards
http://localhost:3000/dashboards or http://docker-host-ip:3000/dashboards if running on a remote host.
Removing the Containers
If you are finished with this demo and ready to remove the containers. Doing this is a simple as running the following command
docker-compose down
Now if you run docker ps -a you will see the dse, prometheus and grafana containers are gone.
All the config files are still located on your host so if you decided to run the demo again, as long as you do not delete the demo data, all you have to do is run the below command again from the demo directory and you will be back where you were prior to destroying.
docker-compose up -d
Whats Next
If you want more granular configuration details, using an existing promethius and grafana servers or instructions to configure metrics collector with existing clusters check out the official DataStax Metrics Collector Documentation