Architectural Patterns
I think that there are only two characteristics we see in all modern application architectures.
- What I’ll call the “front door” or first few parts that constitute the entryway for most data into the system, and
- a few of the parts that process and manage state (data).
The “front door” usually looks like this:
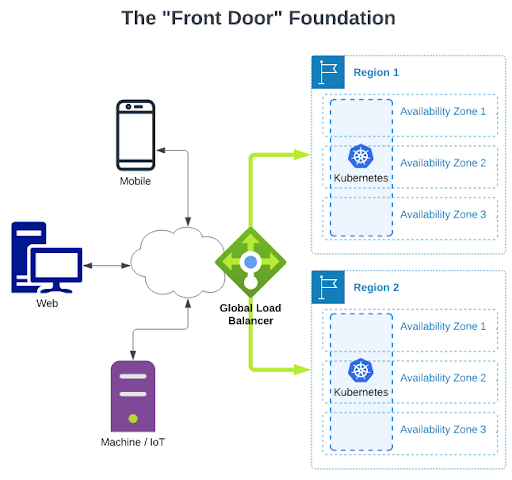
NOTE: Usually “Availability Zone” = “Data Center Building” and “Region” = “multiple buildings relatively near each other”.
This pattern is mostly about the system’s resilience. Generally this pattern has nothing to do with what is going on inside the Kubernetes clusters, and nothing to do with supporting services, databases, or other infrastructure software.
This pattern with multiple regions and a global load balancer gives users a very useful control over where traffic is routed and serviced. During unplanned outages, the global load balancer can automatically shift traffic to the working region. Almost as important is that the user has an easy lever to deliberately shift traffic for planned maintenance or other needs.
Above, I’ve depicted the use of two regions but we’ve seen a surprising (to me) number of apps that only deploy in one region and sometimes on only two availability zones. Redundancy isn’t cheap. The minimum advisable “front door” should look like this:
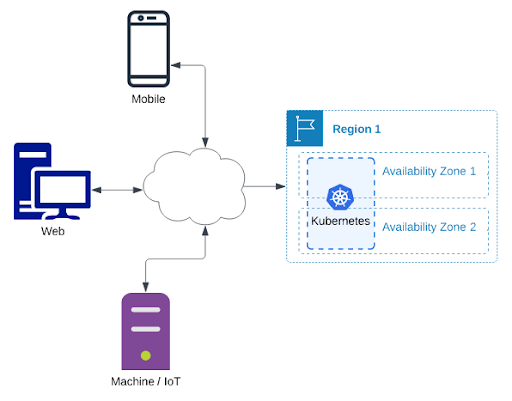
Most modern apps today will run most or all of the processes they directly manage in a Kubernetes cluster. Although that is important, Kubernetes just simplifies many of the common practices of modern application deployment and operation. All, some, or none of the pieces of a typical stateless application architecture may be running inside Kubernetes. In place of Kubernetes we often also see cloud VMs, self-managed VMs (usually VMWare in enterprises) or even bare metal (old school, baby!).
Processing and Managing State (Data)
Most modern applications implement a stateless microservices architecture. A typical stateless-microservices-based application architecture looks like this:
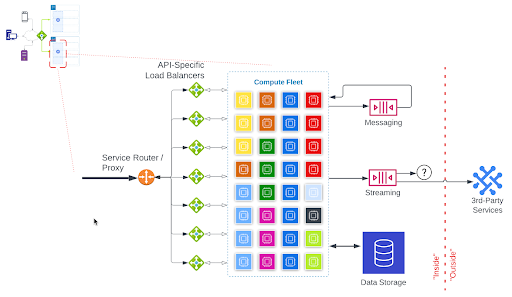
The callout in the upper-left-hand corner shows where this part of the architecture exists in the “front door” illustration.
Traffic flows into the application from the global load balancer into a service router or proxy.
- The Service Router / Proxy usually terminates the TLS/SSL encrypted connection and examines the HTTP request to determine which service is programmed to handle that request. It forwards the request to the appropriate API-Specific Load Balancer.
- Services are typically broken down into dedicated programs that handle specific requests. This is so that they can be scaled independently, based on demand. In order to support independent scaling, each service usually gets its own load balancer, depicted under the “API-Specific Load Balancers” label.
- The processes running in the compute fleet are spread across many physical machines. The processes which are stateless can be easily scaled to add more when demand increases or remove them (to save costs) when demand is lower. When requests are handed off from the load balancer to one of these processes:
-
- The request is processed. This could include:
a. Some kind of computation
b. Reading and/or writing data to/from random-access storage (one or more databases)
c. Reading and/or writing data to/from third-party services
d. Telling one or more other services to do something, usually via a “Messaging queue” or “Streaming topic”
- A response is sent back to who or whatever sent the request
- The service resets, waits for a new request, and the cycle starts over.
- The request is processed. This could include:
When the service resets, it knows nothing about previous requests it has processed. This is the characteristic that defines this as “stateless.” However, all the system does is read, write, and process data, so the data (state) has to live somewhere. Where we decide to put the data depends on how it will be used later.
If the application is writing data that will be read later, in no predictable order, it will use a database.
If the application is writing data that will be read later in a specific order, it will use messaging or streaming.
The terms “Messaging” and “Streaming” are routinely conflated but for the purposes of this blog, we’ll say that Modern Apps usually rely on:
- “Messaging” to coordinate internal operations between APIs/services. When the task is processed, the record of the task itself is usually unimportant and discarded.
- “Streaming” to send larger volumes of data to other systems which may be internal or external. This is usually the route to populate analytical systems, data lakes, and long-term archival.
Compute
In the Processing and Managing State diagram, I’ve created a generic “Compute Fleet” concept that “processes data.” Although this is accurate, these fleets are not usually together in a tidy little box. We commonly see processing segregated into purpose-built clusters. For example:
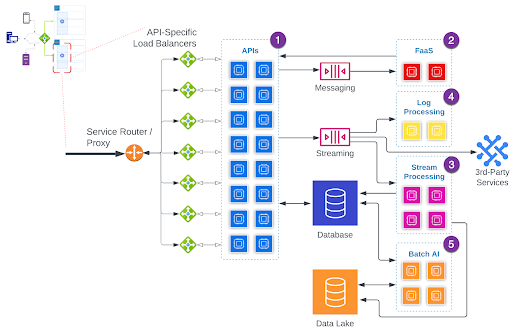
- The transactional request-response flow is usually serviced by many processes (sometimes thousands) maintained by, and running inside of, a Kubernetes cluster or fleet of VMs (cloud- or self- managed).
- Asynchronous task processing is often in a separate Kubernetes cluster or could be handled by a Function-as-a-Service (FaaS) like AWS Lambda (or sometimes a stream processing tool).
- Near/Real-Time computation, transformation, enrichment, and Extract-Transform-Load (ETL) for larger data volumes is handled by Flink, Spark Streaming, or a Cloud Provider equivalent.
- System or activity logs are usually sent to Splunk, Prometheus, or other similar Cloud-based systems tailor-built for processing, analyzing, aggregating, filtering, and alerting from log-type data.
- Bulk data processing, such as batch analytics, is usually handled by a dedicated Spark cluster or Cloud Provider Equivalent.
The order in which I’ve listed these is from shortest response time expectation to longest.
Adding Real-Time AI
Nearly every one of DataStax’s customers have an application architecture like the one depicted above. That’s partly because this architecture can be used in many different ways. It can even be used to provide real-time AI.
Most users begin to add real-time AI to their applications by using inferencing libraries in their existing APIs and compute clusters. Model training processes run in existing Batch AI compute clusters. If the user’s existing databases can meet the needs of these new processes, feature data can be stored and served from there. Existing stream processing infrastructure can usually be extended to handle new real-time AI related processing. You can think of this paradigm as “AI as a Library.”
Some AI/ML works with data in a way which is particularly well suited to GPUs (Graphics Processing Units) - the specialized processors normally used to render and display graphics, videos, or games. Consequently, a common next step to optimize performance is to augment the API and/or Batch compute clusters with GPUs, as needed.
Just because existing infrastructure CAN do Real-Time AI, it doesn’t mean that it is ideal, efficient, or that the staff managing it are experts. As a company’s use of AI matures and AI becomes more widely used, a natural evolution will be to consolidate. To facilitate this, we see both the transactional and batch activities moved to specialized services. You can think of this paradigm as “AI as a Service.”

We’ll use the “Transitional” diagram on the left to illustrate the role each part of the architecture plays in a real-time AI scenario. The same processes play out in the “Final” diagram, but “inside” the Real-Time AI box.
To make this explanation more concrete, let’s think about a simplified version of how a user’s social media feed might be tailored to them.
1 On a regular frequency, possibly nightly, the Batch AI system will process through each user’s social network using data stored in the Data Lake. The Batch AI uses a tailored model to select posts that it thinks that this user will be most likely to read. The data in the data lake is stored in a way that makes this kind of bulk data analysis efficient.
2 The Batch AI system stores the selected list of posts in the Database. The data in the database is stored in a way that makes finding and retrieving this one piece of data fast, efficient, and reliable.
1 A user logs in. The social media app on their phone requests the user’s feed. This is retrieved from the database, sent back to the app, and displayed to the user. The user begins scrolling and pauses to watch a cat video.
2 The app sends an “event” which indicates that the user paused on a video and which video it is. In the Streaming component, this event gets in line with millions of other events and waits to be serviced. In most cases it will wait less than a second. Maybe only a few milliseconds.
3 The Stream processing component grabs events one-at-a-time from the Streaming component and processes them. In order to process this event, it needs to talk to the Database to determine what type of video this is - a cat video - and then use a model very similar to the one the Batch AI used to find more videos that are similar to the one the user appeared to like.
4 The updated list of videos is saved back to the database, waiting for the user’s app to request more videos for the feed. This is also considered a prediction of what the user might like.
5 This kind of prediction data is also useful information for the nightly Batch AI, so the Database sends that data to the Data Lake using Change Data Capture (CDC).
6 The user has continued to scroll and is now nearing the end of the first list which was retrieved in step 1. The app asks for more posts and retrieves the updated list of predictions which were just produced.
The time necessary to go from 1 to 4 will vary depending on many factors but under most circumstances it will happen in less than a few seconds. 5 happens within a few seconds. 6 is dependent upon the user.
Products and Services
So far in this blog, I’ve chosen to mostly avoid referencing a specific vendor or solution. In the previous diagram, although I have “Third-Party Services” seemingly at the end of the line and only receiving data, there are third-party fully-managed service offerings for every icon in this diagram. There are also multiple self-managed software offerings.
The user has to choose which parts they want to closely control and which parts they want to use as a managed service. In some cases, a user may select two or more solutions for similar roles. For example, it is fairly common for us to see the architecture for a single application contain two or more database solutions. We may also see an architecture with one tool performing the duty of multiple boxes in the diagram. For example, for simpler applications one product may be able to gracefully handle Messaging, Streaming, Stream Processing, and Function-as-a-Service responsibilities.
Here is an opinionated diagram that selects what I consider to be the current best-of-breed options in each area:
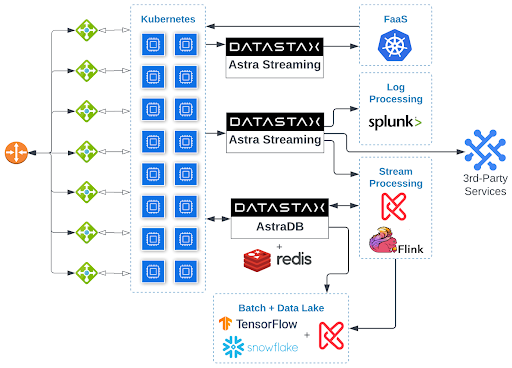
Obviously I’m partial to DataStax technologies; they’re all over this diagram. The fact that DataStax has a best-of-breed solution for so many of the challenges my applications face is one of the reasons it is all over this diagram.
… And That’s Not All, Folks
At this level of detail, it’s probably worth mentioning some important parts that I’m not addressing at all.
- Security (AuthN, AuthZ, networking & firewalls, key management, configuration management, intrusion detection, etc.)
- Backup, Restore, Archival, Blob Storage
- Front-End caching, Content-Delivery Network (CDN), static asset management
- Continuous Integration / Continuous Delivery
- Automated testing (unit, integration, load/stress, ML model development)
- Diagnostics infrastructure beyond logging
- Private container registry / code management
- Use-Case-Specific third-party vendors that tend to show up in many solutions, such as MailGun, SendGrid, Stripe, Paypal, etc.
- Popular third-party integrations such as Salesforce, Google Analytics, Google Search, and a laundry list of social media.


