Cassandra’s built-in key and row caches can provide very efficient data caching. Already, several Cassandra users who care deeply about read performance have leveraged these caching features to effectively pry dedicated caching tools such as memcached completely out of the stack. Such deployments not only remove a redundant layer, but they also achieve the fundamental efficiency of strengthening caching functionality down in the lower tier where the data is already being stored. Among other advantages, this means that caching never needs to be restarted in a completely “cold” state.
With proper tuning, hit rates of 85% or better are possible with Cassandra, and each hit on a key cache can save one disk seek per SSTable. Row caching, when feasible, can save the system from performing any disk seeks at all when fetching a cached row. Then, whenever growth in the read load begins to impact your hit rates, you can add capacity to quickly restore optimal levels of caching.
Configuring Key and Row Caches
Key caching is enabled by default in Cassandra, and high levels of key caching are recommended for most scenarios. Cases for row caching are more specialized, but whenever it can coexist peacefully with other demands on memory resources, row caching provides the most dramatic gains in efficiency.
Key Cache
The key cache holds the location of keys in memory on a per-column family basis. For column family level read optimizations, turning this value up can have an immediate impact as soon as the cache warms. Key caching is enabled by default, at a level of 200,000 keys.
Row Cache
Unlike the key cache, the row cache holds the entire contents of the row in memory. It is best used when you have a small subset of data to keep hot and you frequently need most or all of the columns returned. For these use cases, row cache can have substantial performance benefits.
Key and Row Cache Hits at Runtime
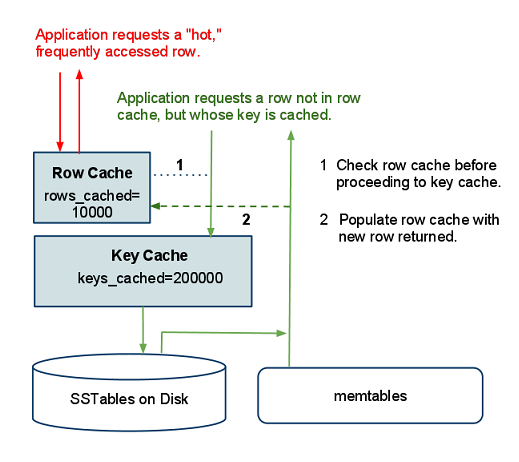
In a scenario where both row and key caches are configured, the row cache will return results whenever possible. In the case of a row cache miss, the key cache may still provide a hit that makes the disk seek much more efficient. In this example with both caches already populated, two read operations on a column family are depicted:

One read operation hits the row cache, returning the requested row without a disk seek. The other read operation requests a row that is not present in the row cache but is present in the key cache. After accessing the row in the SSTable, the system returns the data and populates the row cache with this read operation.
Data Modeling for Cache Performance
If your requirements permit it, a data model that logically separates heavily-read data into discrete column families can help optimize caching. Column families with relatively small, “narrow” rows lend themselves to highly efficient row caching. By the same token, it can make sense to separately store lower-demand data, or data with extremely long rows, in a column family with minimal caching, if any.
Row caching in such contexts brings the most benefit when access patterns follow a normal (Gaussian) distribution. When the keys most frequently requested follow such patterns, cache hit rates tend to increase. If you have particularly “hot” rows in your data model, row caching can bring significant performance improvements
Tuning for Optimal Caching
Careful, incremental testing is essential to maximizing benefit from Cassandra’s caching features. Adjustments that increase your cache hit rate are likely to decrease the system resources available for your write load and other operations. After making changes to cache configuration, it is best to monitor Cassandra as a whole for unintended impact on the system.
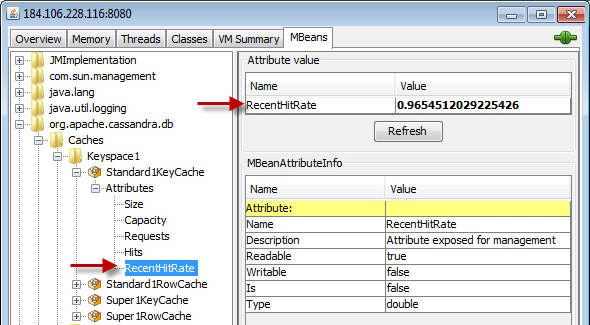
The jconsole GUI can be a helpful tool for monitoring caching metrics exposed through JMX. For each node and each column family, you can view your cache hit rate, cache size, and number of hits by expanding org.apache.cassandra.db in the MBeans tab. For example:

If you are an DataStax OpsCenter user, you can monitor your cache rates in Performance tab, adding cache graphs to your main view if you prefer.


