
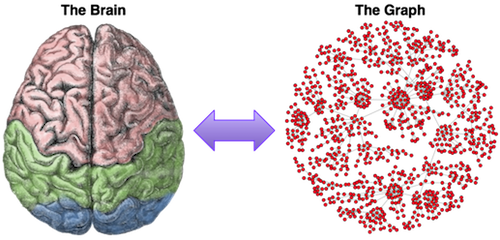
A graph database is a software system that persists and represents data as a collection of vertices (i.e. nodes, dots) connected to one another by a collection of edges (i.e. links, lines). These databases are optimized for executing a type of process known as a graph traversal. At various levels of abstraction, both the structure and function of a graph yield a striking similarity to neural systems such as the human brain. It is posited that as graph systems scale to encompass more heterogenous data, a multi-level structural understanding can help facilitate the study of graphs and the engineering of graph systems. Finally, neuroscience may foster a realization and appreciation of the various structural abstractions that exist within the graph.
The Neuron and the Vertex
At a primitive level, the structure of the human brain can be described as a network of neurons. Likewise, the structure of a graph can be described as a network of vertices. Thus, a simple analogy between these two structures can be made, where neurons are vertices and connections are edges.
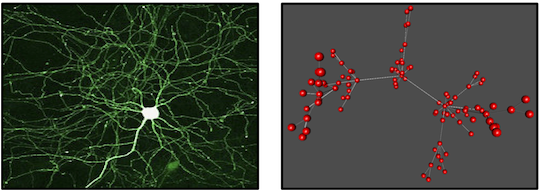
The human brain is believed to be composed of approximately 100 billion neurons and 1 quadrillion connections (1 quadrillion is 1000 trillion). If the human brain was only understood at the level of neurons, then the brain would be too complex to reason about. Similarly, if a graph of 100 billion interconnected vertices was only studied from the vantage point of vertices and edges, then the structure would be too overwhelming to grasp. To combat this problem, in both cognitive neuroscience and network science, it is typical to abstract away the low-level connectivity patterns in order to realize larger functional structures. In neuroscience, some techniques used to do this are itemized below.
- Neurons: Invasive microelectrodes can be used to measure the activity of a single neuron (or small group of neurons) during the presentation of a stimulus.
- Areas: Staining allows researchers to identify the metabolic enzyme cytochrome oxidase and thus expose larger circuits participating in the processing of sensory input.
- Regions: Non-invasive fMRI techniques leverage the magnetic aspects of hemoglobin which is utilized by areas of the brain during a cognitive task or presentation of stimuli.
In network science, algorithms exist to identify larger structures within the graph. Most of the descriptive statistical algorithms developed are used for this purpose. Some of these techniques are itemized below.
- Vertices: Measuring degree or centrality scores help to identify a vertex's role within the larger graph.
- Motifs: It is possible to identify lines, trees, cycles, cliques, etc. which are associated with known functions.
- Subgraphs: Leveraging community detection algorithms or graph minors help to locate large structural areas within the graph that have high intra-connectivity and low inter-connectivity.
In general, in order to have a well-rounded understanding of either the brain or the graph, abstractions over its structure are required.
The Area and the Motif
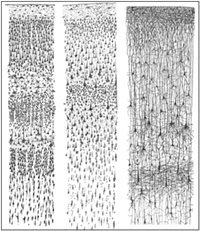 The human cortex is composed of numerous distinct structures known generally as functional areas (see Brodmann areas for the relationship between cytoarchitecture and function). Different areas are responsible for different types of processing. With respects to the visual cortex, there are 5 areas that form distinct neuronal layers: V1, V2, V3, V4, and V5/MT. This "layering" of areas is presented in the image on the left. Each area is responsible for determining certain qualities of the visual stimuli. For example, in V1, each neuron responds to a line orientation in a specific area of the receptive field (i.e. the retina). One neuron will only respond to a line that is vertical in the top-left region of the retina, while another will only respond to a line that is horizontal in that same region. Neurons with the same tuning are organized into "slabs" (or columns), where a complete slab corresponds to the entire receptive field. The information distilled in V1 is then propagated to the other areas of the visual cortex that identify motion, depth, color, complex geometries, objects, etc.
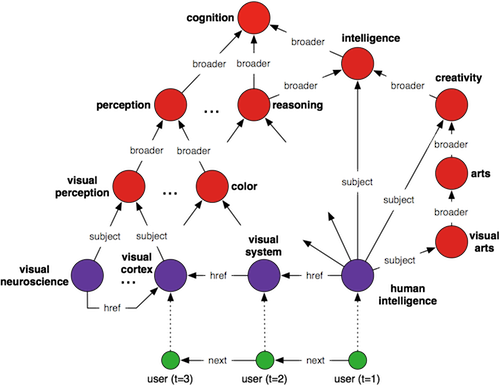
In analogy to the brain's functional areas, functional motifs can be identified in real-world graphs. Motifs are prevalent in a type of graph known as a multi-relational graph. A multi-relational graph is composed of a set of heterogenous vertices (e.g. people, webpages, categories) and a set of directed labeled edges (e.g. friend, wrote, read, broader). The Wikipedia graph, made freely available by DBPedia, is an excellent example of a multi-relational graph containing numerous motifs. In particular, a taxonomical motif is found in its category system (note that the Wikipedia category system is not a directed acyclic graph). In this taxonomy, there are high-level categories such as cognition (the red vertices). Cognition is refined by more specific categories: intelligence, reasoning, perception, etc. Ultimately, at the lowest-level, Wikipedia pages (the purple vertices) have subject-edges projecting to the vertices in the taxonomy that best represent them (typically to categories lower in the taxonomy). Similar to how sensory input stimulates the functional areas of the visual cortex, Wikipedia's taxonomy can be stimulated by user usage. For example, a Wikipedia user (the green vertex) may click on the human intelligence page at timestep 1. The general context/intention of the user's click is ambiguous as human intelligence is the source of numerous paths within the taxonomy --- there is simply not enough information to get a specific understanding of the user's knowledge acquisition desire (creativity? reasoning? perception?). The most general understanding is that the user is interested in cognition. However, as the user clicks on more pages (e.g. visual system, visual cortex), the graph is able to "realize" that the user is interested in the more neuroscience aspects of cognition -- more specifically, as it relates to humans. The graph processes the click-stream behavior of the user in order to converge upon a category (or set of categories) that best represents that user's information searching behavior. Note that Wikipedia does not leverage this algorithm as it is primarily a static representational structure. However, in order to draw an analogy to signal processing in the brain, this usage example was presented.
The Region and the Subgraph
In cognitive science, at the macro-level, the brain is understood as a information storage and processing system composed of regions that are responsible for specific behaviors -- a true society of mind. These regions communicate with one another via pathways in order to elicit the complex external and internal behavior of the human being. For example, the auditory cortex and visual cortex collaborate to converge upon the concept of a dog that is both barking and is in the human's visual field. Neuroscience has identified numerous high-level regions. These named regions and their known function is provided in the table below. Note that it is typical for regions to have more than one function. However, for the sake of simplicity, only one function is presented. Finally, the image on the left demonstrates how (Brodmann) areas are grouped into regions.
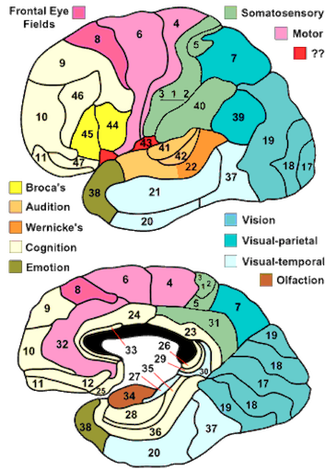 Courtesy of Professor Mark Dublin's lecture on Brodmann areas. |
region | function |
| Temporal lobe | speech processing | |
| Visual cortex | vision processing | |
| Auditory cortex | auditory processing | |
| Amygdala | emotion processing | |
| Frontal cortex | abstract reasoning | |
| Motor cortex | voluntary movement | |
| Hippocampus | long-term memory | |
| Pineal gland | sleep/wake patterns | |
| Cerebellum | fine motor control | |
| Thalamus | information relay | |
| Piriform cortex | perception of smell | |
| Alpha system | muscle contraction |
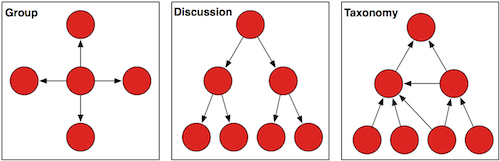
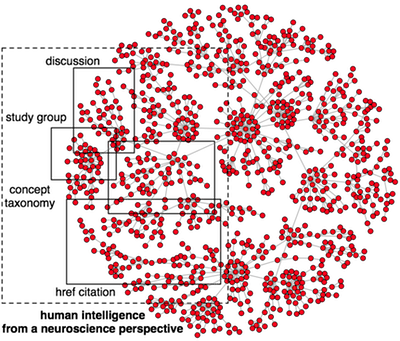
In multi-relational graphs, functional regions are made apparent as functional subgraphs. A subgraph contains multiple graphical motifs that collectively solve a particular problem. Expanding upon the Wikipedia taxonomy motif presented earlier, that taxonomy exists within a larger subgraph. For example, Wikipedia users can be contained in a study group motif. The structure of a study group is realized as a single vertex (denoting the group) connected to users via hasMember-edges (i.e. a bag of vertices). Likewise, a discussion board motif may emerge from that study group. A discussion board is strictly hierarchical in nature, where a root comment is connected, in a recursive fashion, to other comment vertices via hasComment-edges. Finally, each of those comments may have projections/links to Wikipedia pages or categories that expand on the ideas presented in the comment. The aggregation of these motifs form a functional subgraph whose purpose is to understand human intelligence from a neuroscience perspective.
Conclusion
This post presented three structural abstractions found in human brains and in multi-relational graphs. The purpose of structural abstraction is to aid researchers and engineers in the understanding and design of complex systems. The graph database space is developing infrastructure capable of representing and processing a variegated information landscape within a single, unified, atomic graph structure. As this proceeds, it will become more important to think in terms of structural abstractions in order to better reason about the graph and to develop algorithms that are better able to leverage it for collective problem-solving. In many ways, this is analogous to how the human brain's structures and processes are leveraged for individual problem-solving.
Acknowledgement
The images that are not directly referenced were provided by Wikipedia or generated by the author.
References
Radomski, M., "Human Brain Capacity in Terabytes," Mark Radomski's WordPress Blog, May 2008.
Best, B., "Basic Cerebral Cortex Function with Emphasis on Vision," The Anatomical Basis of Mind, 2004.
Rodriguez, M.A., "Graphs, Brains, and Gremlin," Marko A. Rodriguez's WordPress Blog, July 2011.
Bollen, J., Van de Sompel, H., Hagberg, A., Bettencourt, L.M.A, Chute, R., Rodriguez, M.A., Balakireva, L.L., "Clickstream Data Yields High-Resolution Maps of Science," PLoS One, Public Library of Science, 4(3), e4803, 2009.
Rodriguez, M.A., Ham, M.I., Gintautas, V., Kunsberg, B.S., "A Prospectus on the Obstacles Inhibiting the Implementation of Advanced Artificial Neural Systems – Part 1," Decade of Mind IV Conference, Albuquerque, New Mexico, January 2009.
Ham, M.I., Gintautas, V., Rodriguez, M.A., Bennett, R.A., Santa Maria, C.L., Bettencourt, L.M.A., “Density-Dependence of Functional Development in Spiking Cortical Networks Grown in Vitro,” Biological Cybernetics, 102(1), pp. 71-80, March 2010.
Rodriguez, M.A., "From the Signal to the Symbol: Structure and Process in Artificial Intelligence," PostDoctoral Public Lecture at the Center for Nonlinear Studies, Los Alamos National Laboratory, November 2008.
Minsky, M., "Society of Mind," Simon & Schuster Press, March 1988.
Heylighen, F., "Collective Intelligence and its Implementation on the Web," Journal of Computational and Mathematical Organization Theory, 5(3), October 1999.
More Technology
View All
How to Create a Local LangChain Vector Database

Apache Cassandra 2024 Wrapped: A Year of Innovation and Growth

How We Built UnReel: An AI-Generated, Multiplayer Movie Quiz