Missed Graph Day 2018? How sad! But here is a blog to fill you in on some of the fantastic talks that were featured at Graph Day 2018!
Graph Day 2018
If you missed out on Graph Day 2018 you missed out on a fantastic keynote, wonderful talks, and great discussions! This small summary of each talk, can't truly do them justice! Be sure to stay tuned for messages about Graph Day 2019 which will be in Austin, TX!
Keynote - From Theory to Production: Dr. Denise Gosnell
Dr. Gosnell's keynote kicked off the day in a very fun and informative way. 6 lessons learned from production graph application ... via SimCity 2000. When Dr. Gosnell took a step back from the last 10 years of her career, she could easily see a parallel between the steps it takes to *win* at SimCity 2000 and to *win* at putting graph applications into production.
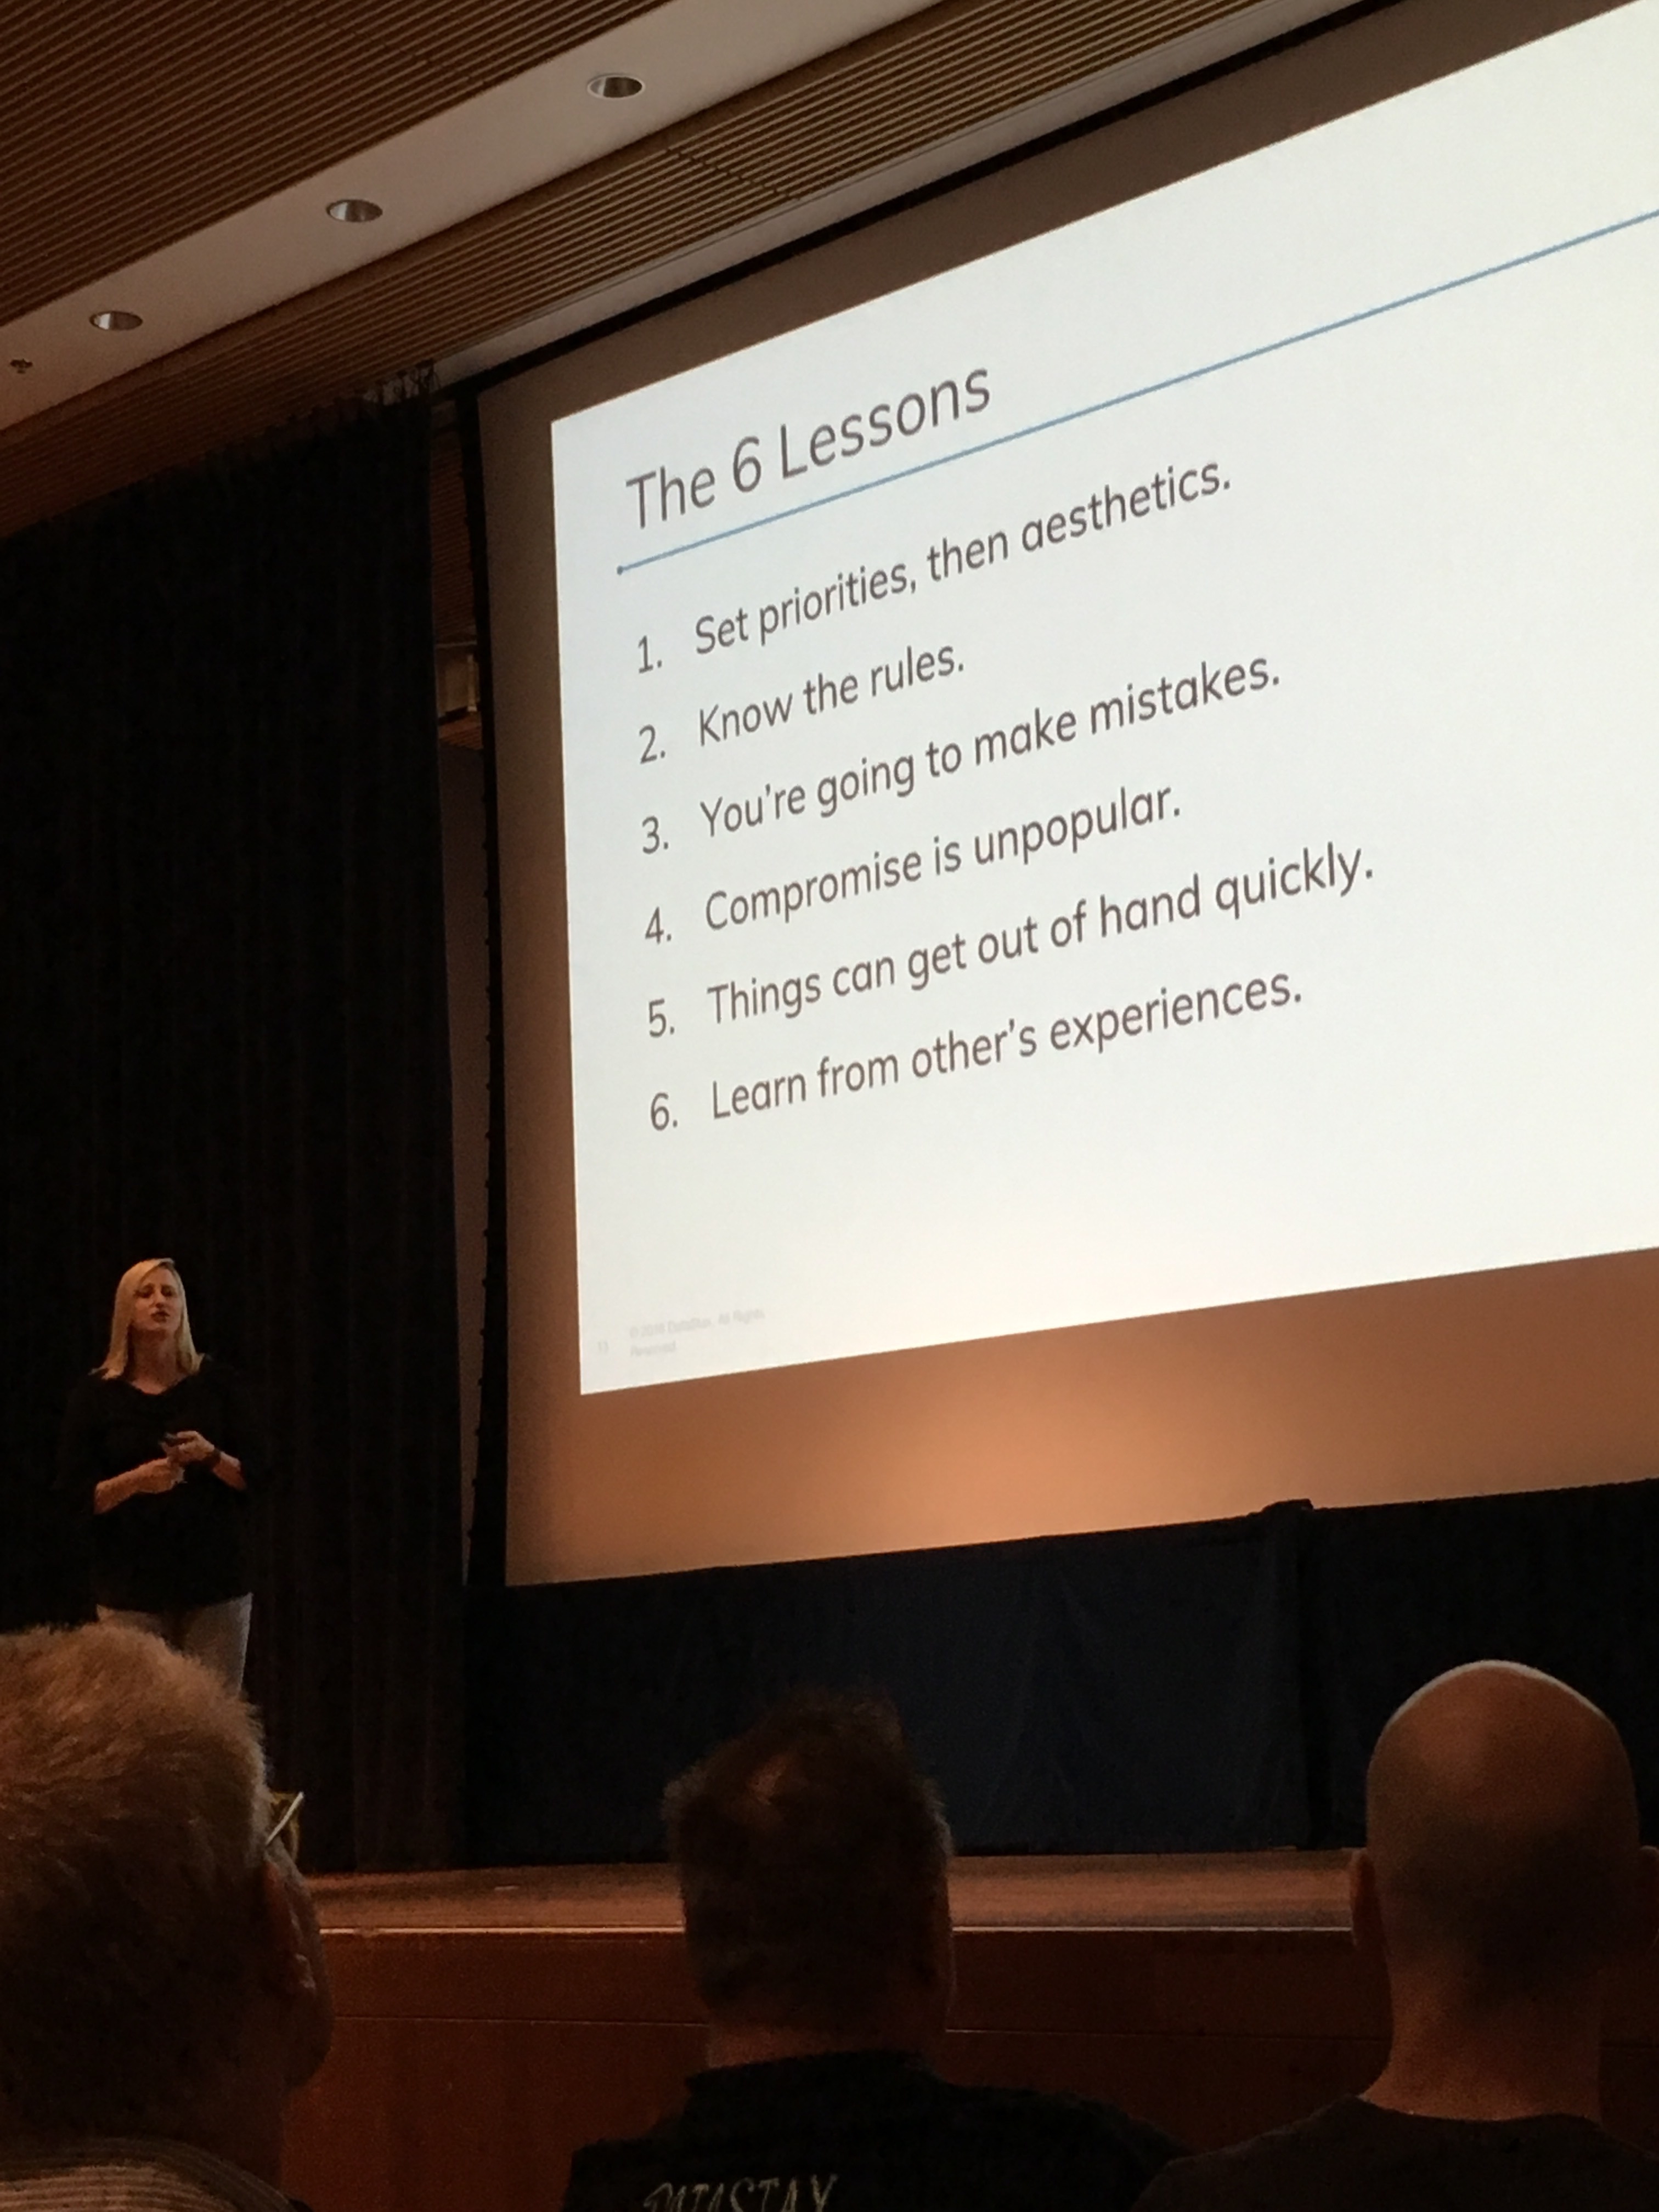
Set priorities, then aesthetics
Know what you absolutely need to get done and into production first, then add to that. This is one of the cornerstones of Agile development, but so easily forgotten. It takes time to understand and outline your minimum viable product (MVP) for production, but take the time and you will benefit! Once you have a foundation you can build on, you are golden!
Know the rules
To be successful, you have to understand the rules of the "game" and what your end goal is. When moving from the relational model world to the graph model world, you have to flip your thinking. It's not just about entities, its about the relationships between those entities. How do I get from Point A to Point B, and what did I learn a long the way? Two new concepts come out of the graph model way of thinking: traversal branching factor and traversal specificity:
- Branching factor - considering the number of edges (or relationships) between each node. The number of edges between nodes needs to be carefully considered as this may begin to scale out in a non-linear fashion, which will lead to increased CPU usage and traversal time.
- Utilizing traversal specificity, by considering your edge and vertex labels during the traversal will be incredibly beneficial. If you know the "rules of the game" and where you are headed, you will be headed in the right direction!
You’re going to make mistakes
This is fantastic advice to always remember for your production systems as well as life in general. People make mistakes. People make bad assumptions. But when things start to go sideways, what should you look for as a red-flag. Dr. Gosnell provided 3 areas to take a closer look at if things are going wrong in your production (or even dev!) graph.
- Search indices for everything -- Search indices are very powerful and useful, but if they are on every element or property, this is probably not correct.
- Semantic Property Matching -- Are you trying to figure out if two people or things are the same by comparing their properties? If so, that is likely not a good fit for a graph database.
- A graph backend for a BI dashboard -- If your customer is looking for basic reporting they might not need a graph solution. Work closely with your customer to get the requirements upfront.
For each of these red-flags, take a step back and review what you are actually trying to do. Are you using the right tools for the job?
Compromise is unpopular
Members of a team all come with different perspectives and history. This is what makes working as a team so rewarding, but can also lead to unpopular compromises. A prime example of this is the concept of "Short Cut Edges". These edges can significantly reduce your traversal time by creating a direct path between two points that normally take multiple "hops" to get to. Sounds great, right? Not if you need to understand the full relationship between those two vertices - you are ignoring a lot of potential useful information by creating a short cut. At the end of the day, present your ideas to your customer and allow them to make the best choice for them.
Things can get out of hand quickly
Without proper planning, or even with proper planning, issues can arise in graph applications. Supernodes can exist on a system that slowly build and then quickly crash the system during traversals. While supernodes may be interesting, they have the potential to bring down your production database.
Learn from other’s experiences
The graph community has a wealth of knowledge, learn from each other! Continue to build this community of experts, and share your trials and successes. Everyone in the community can benefit.
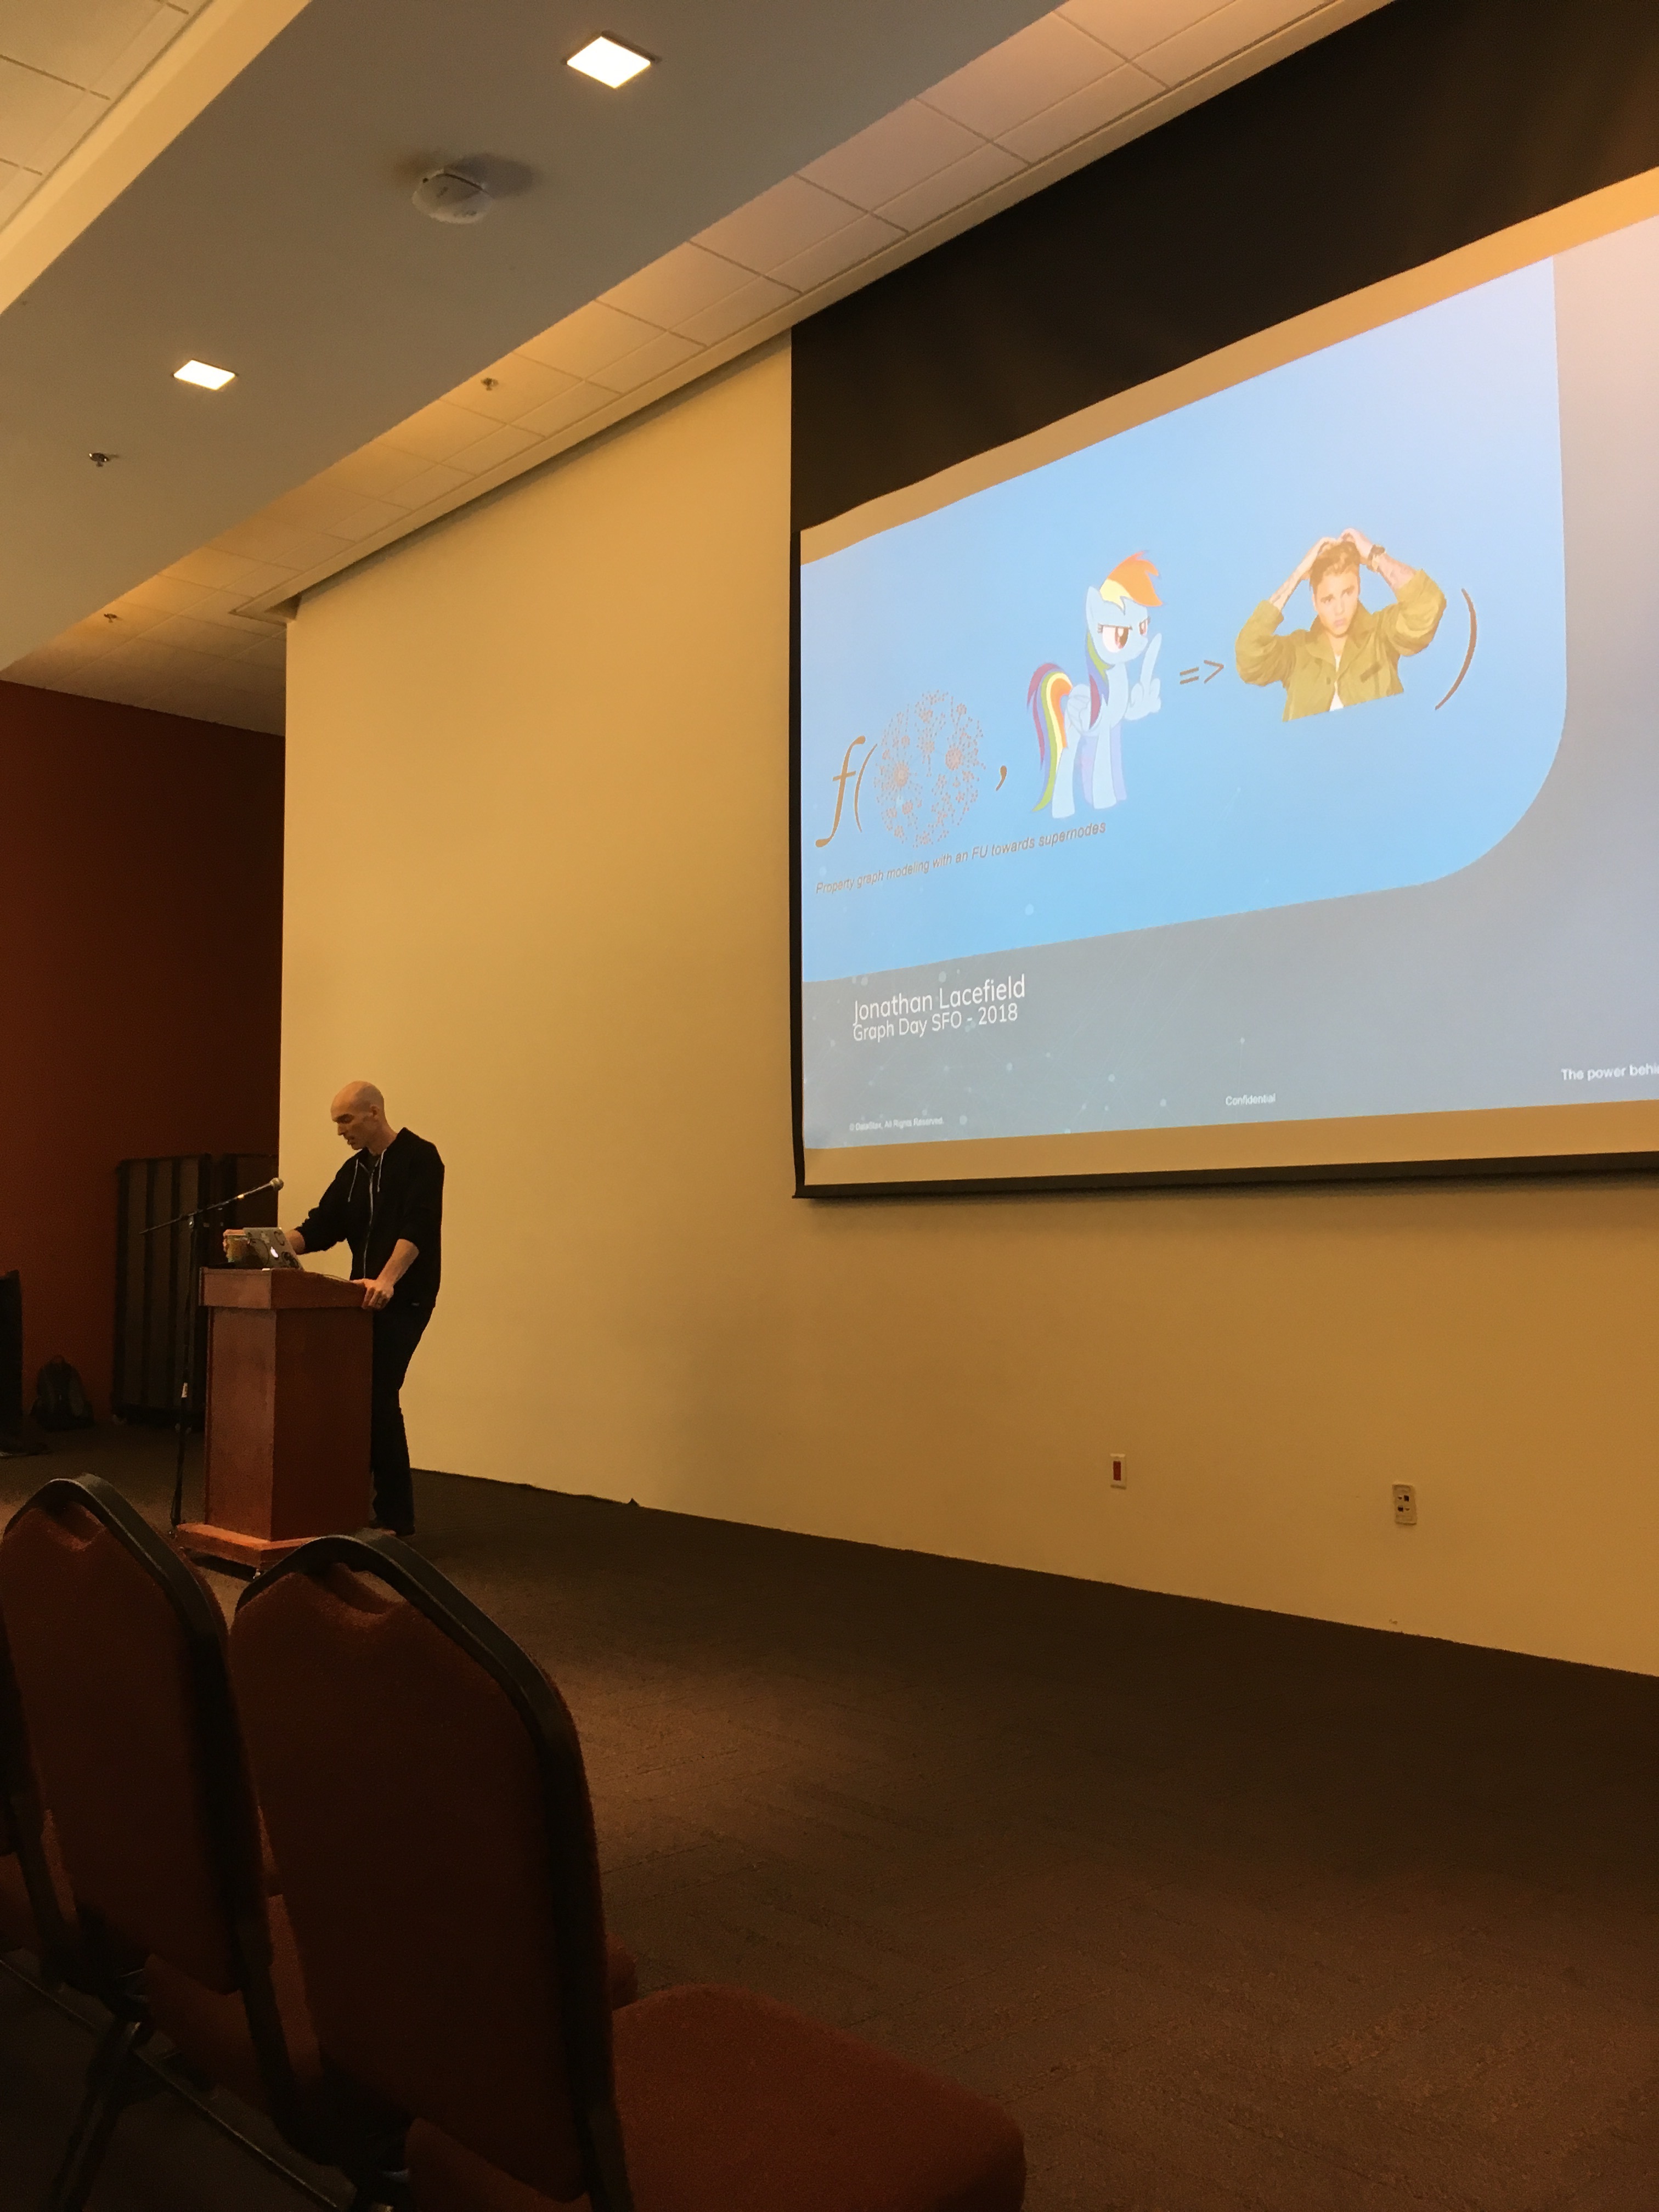
Data Modeling with an FU to Super Nodes: Jonathan Lacefield
It's so nice to see the DataStax team has an amazing sense of humor. Jonathan spoke about tackling the issues of supernodes and wasn't afraid to say exactly what he felt!
The talk was broken up in 3 sections:
- Introduce what is a supernode
- Explain common patterns that lead to supernodes and how to avoid them
- Practical tips on what to do when you think you have a supernode
Introduce What is a Supernode
A supernode is any vertex that has an abnormally high rate of connectivity and is adjacent to many vertices. In simple terms, a supernode has a ton of edges! At first glance this might not seem like much of an issue, and actually sounds like an interesting property of your graph. While supernodes may be interesting, they have the potential to bring down your production database. Without taking the precautions to prevent supernodes, your graph database probably has supernodes waiting quietly to wreak havoc on your database! Traversal time could explode and the number of traversal objects that are created during the walk through the graph could eat up all the resources on your machine. This will lead to performance issues, stability issues, potentially Incorrect/Partial Results, and visualization issues. Those are a lot of potential issues to just leave up to luck!
Common Patterns that Lead to Supernodes
There are three common ways that supernodes appear in your graph database. One, model explicitly (you meant to do that!). Two, modeled accidentally (you didn't mean to do this and it's easy to fix). And three, issues with data ingestion (which is the hardest to fix).
Practical Tips
To defend against supernodes, you have to take a proactive approach. Leaving data modeling, database optimization, and data pipelines purely up to chance is a recipe for disaster. Jonathan outlined these practical tips:
- Know Your Data Model Cardinality/Profile Your Data
- Distributions of Relationships
- Outliers Matter
- Use Architecture/Database Optimizations
- Setup Defensive Data Pipelines
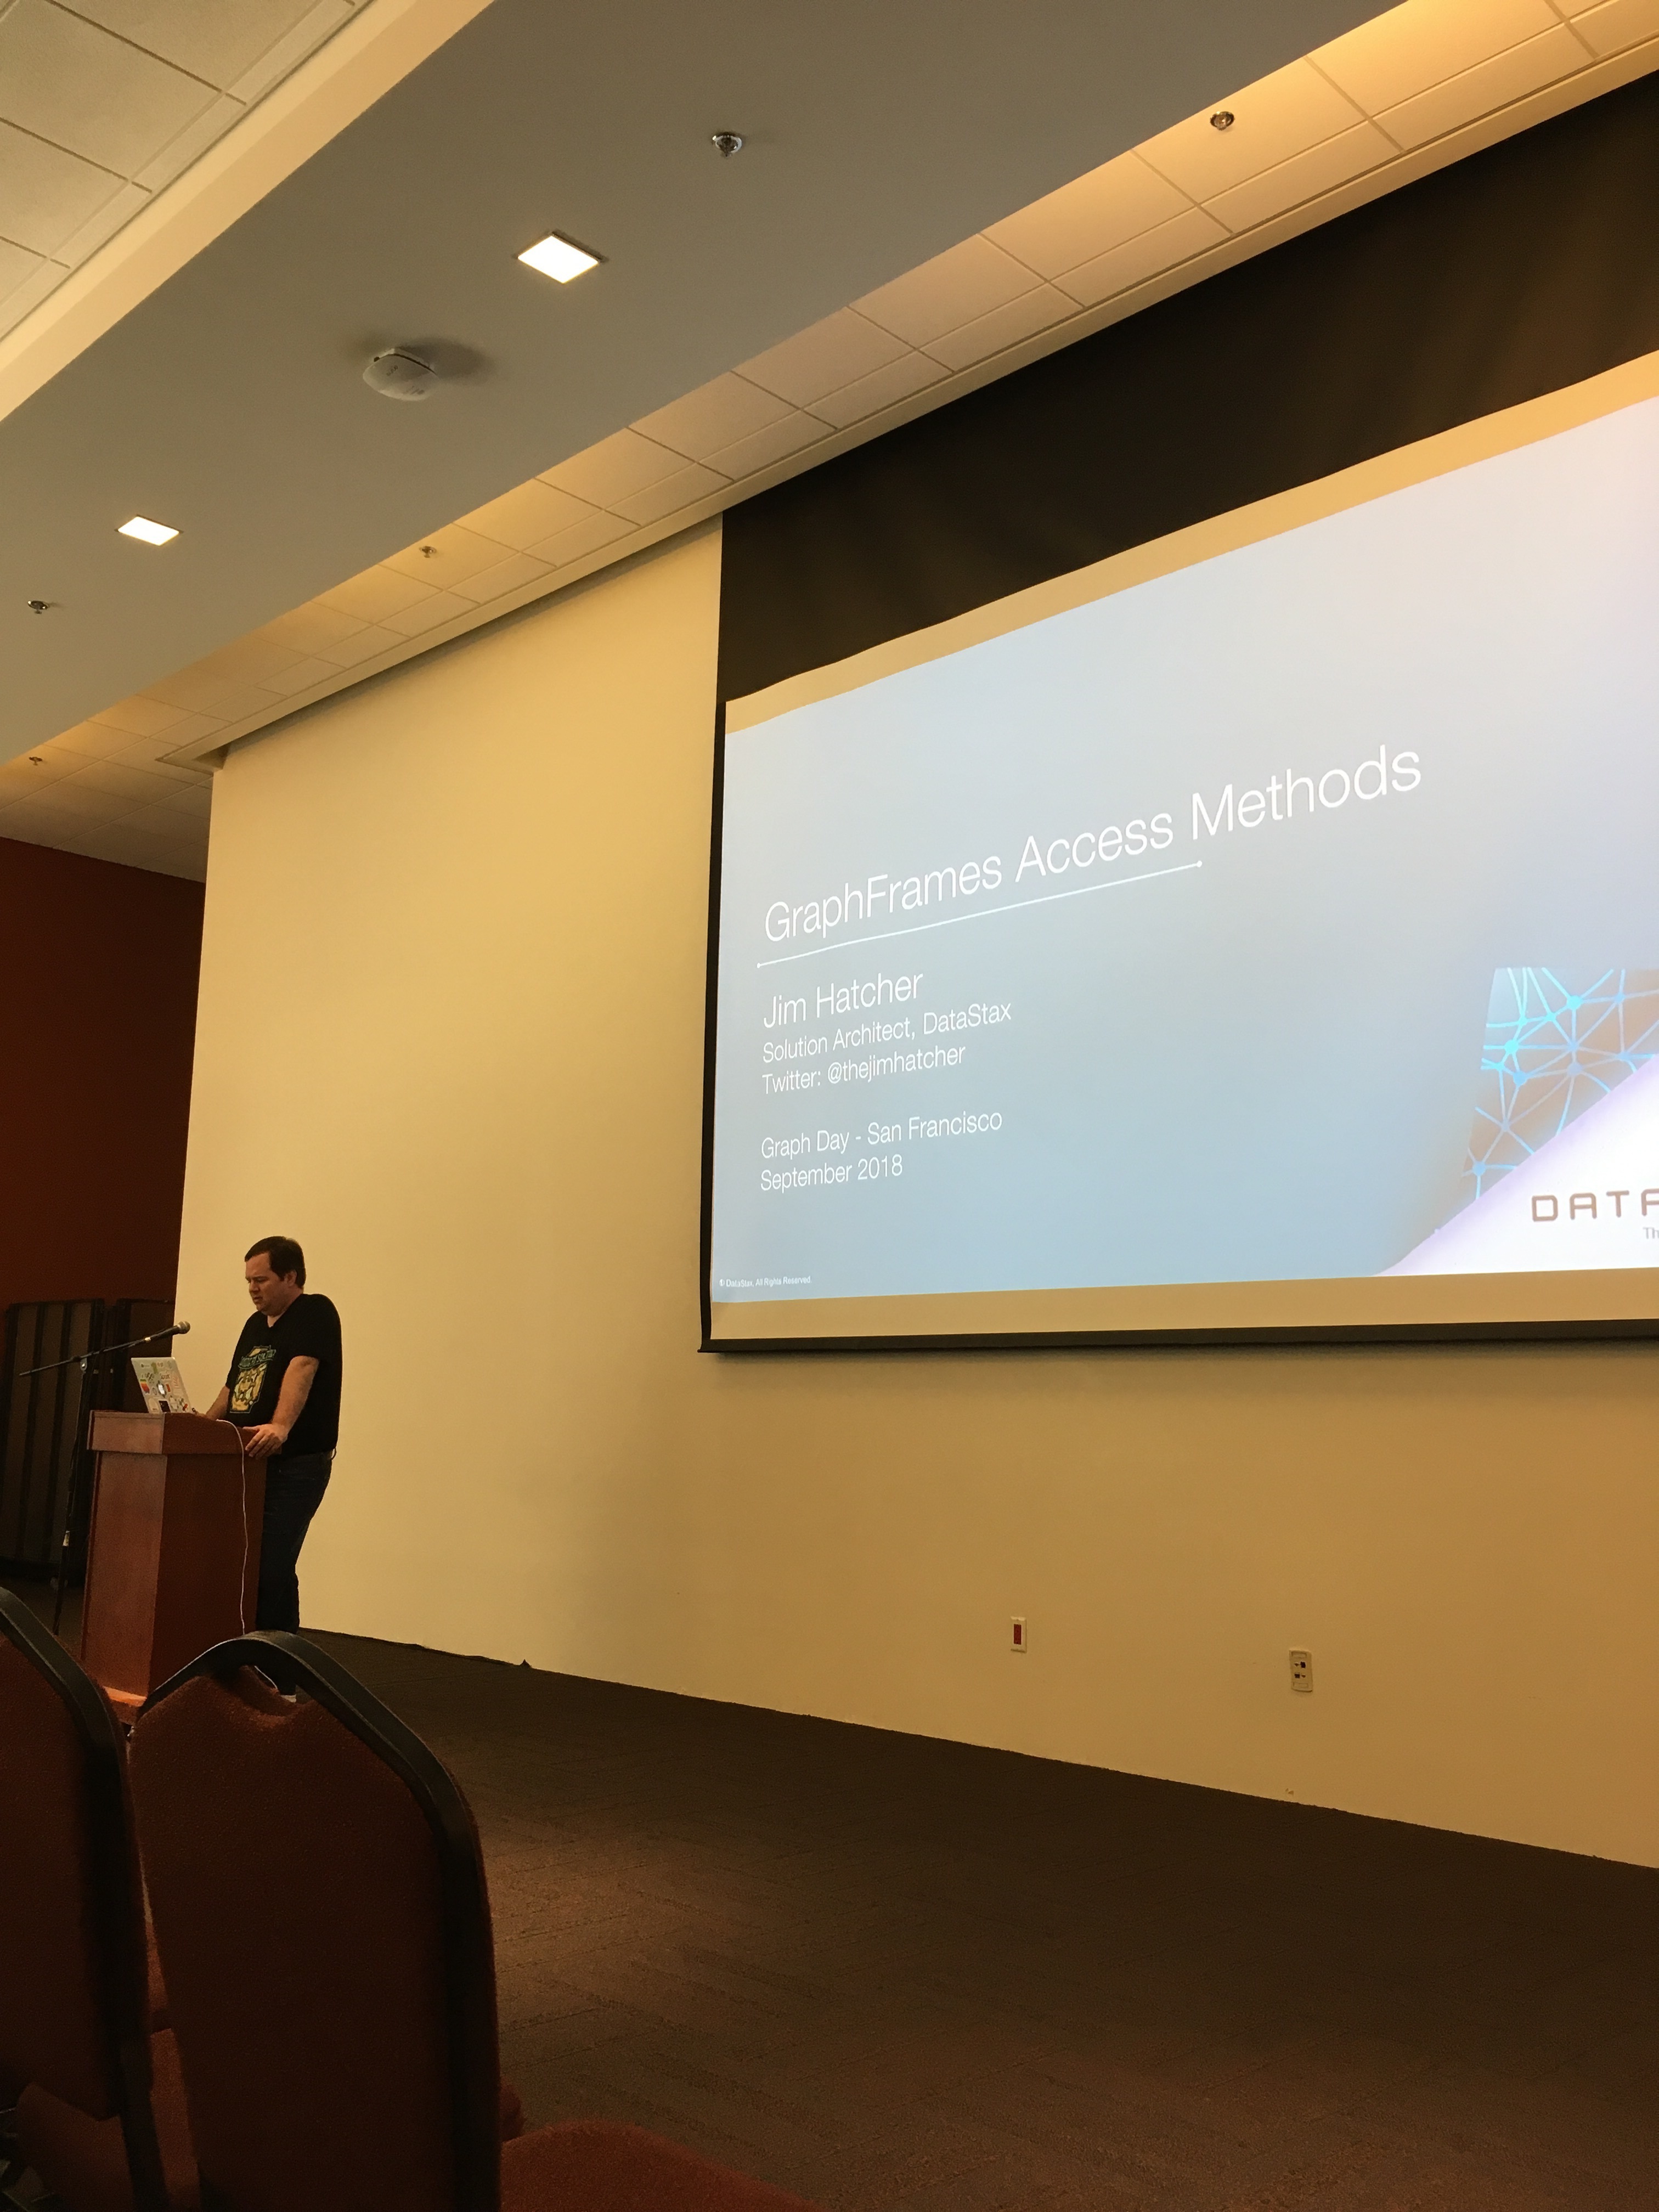
Comparing GraphFrames access methods in DSE Graph: Jim Hatcher
While all the talks I attended were outstanding, Jim's has a special place in my heart because he was willing to show a live demo with code! These are always my favorite types of talks because they are so empowering, I can do that! Jim showed how easy it is to move from a graph loaded in Cassandra to Apache Spark GraphFrames by utilizing DSEGraphFrames.
Apache Spark GraphFrames have many capabilities that utilize the power of Spark:
- Spark SQL
- Memory Optimization
- Query Plan Optimization
- Parallelization / Resilience / Distribution
GraphFames can be utilized by many power algorithms (few listed):
- Shortest Paths
- Page Rank
- Breadth-First Search (BFS)
Creating a DSEGraphFrame is as easy as:
val g = spark.dseGraph("killrvideo")
With DSEGraphFrames you can effectively mutate graphs which is not able to be done with OSS GraphFrames. This can help migrate graphs to a new graph schema, add shortcut edges, and remove nodes with particular labels. You can also use the power of the algorthiums above to quickly find shortest path, which would be very resource and timely in a typical traversal.
In this example a DSEGraphFrame that was created from a DSE table representing movies and actors can be used to find the shortest path to a movie that both John Wayne and James Stewart starred in together, with 4 lines of code!
val johnWayneId = g.V.has("person", "name", "John Wayne").df.collect()(0)(0)

val jamesStewartId = g.V.has("person", "name", "James Stewart").df.collect()(0)(0)

val shortestPaths = g.shortestPaths.landmarks(Seq(johnWayneId, jamesStewartId)).run
shortestPaths.show()
How Do *You* Graph? - Minimizing Developer Impedance: Ben Krug

Ben discussed the sometimes-unrecognized similarities between graph and relational databases. He talked about how developers work with the data, and compared methods and tools, to show that knowledge of relational can help in the graph world. Gremlin is the "graphy" tool, and is both declarative and imperative. Tools like SparkSQL and DseGraphFrames allow us to work with graph from a relational viewpoint, also in both declarative and imperative ways. There is a lot of FUD (fear-uncertainty-doubt) out there, and he emphasized the variety of tools, and the need to choose the right one for the job.
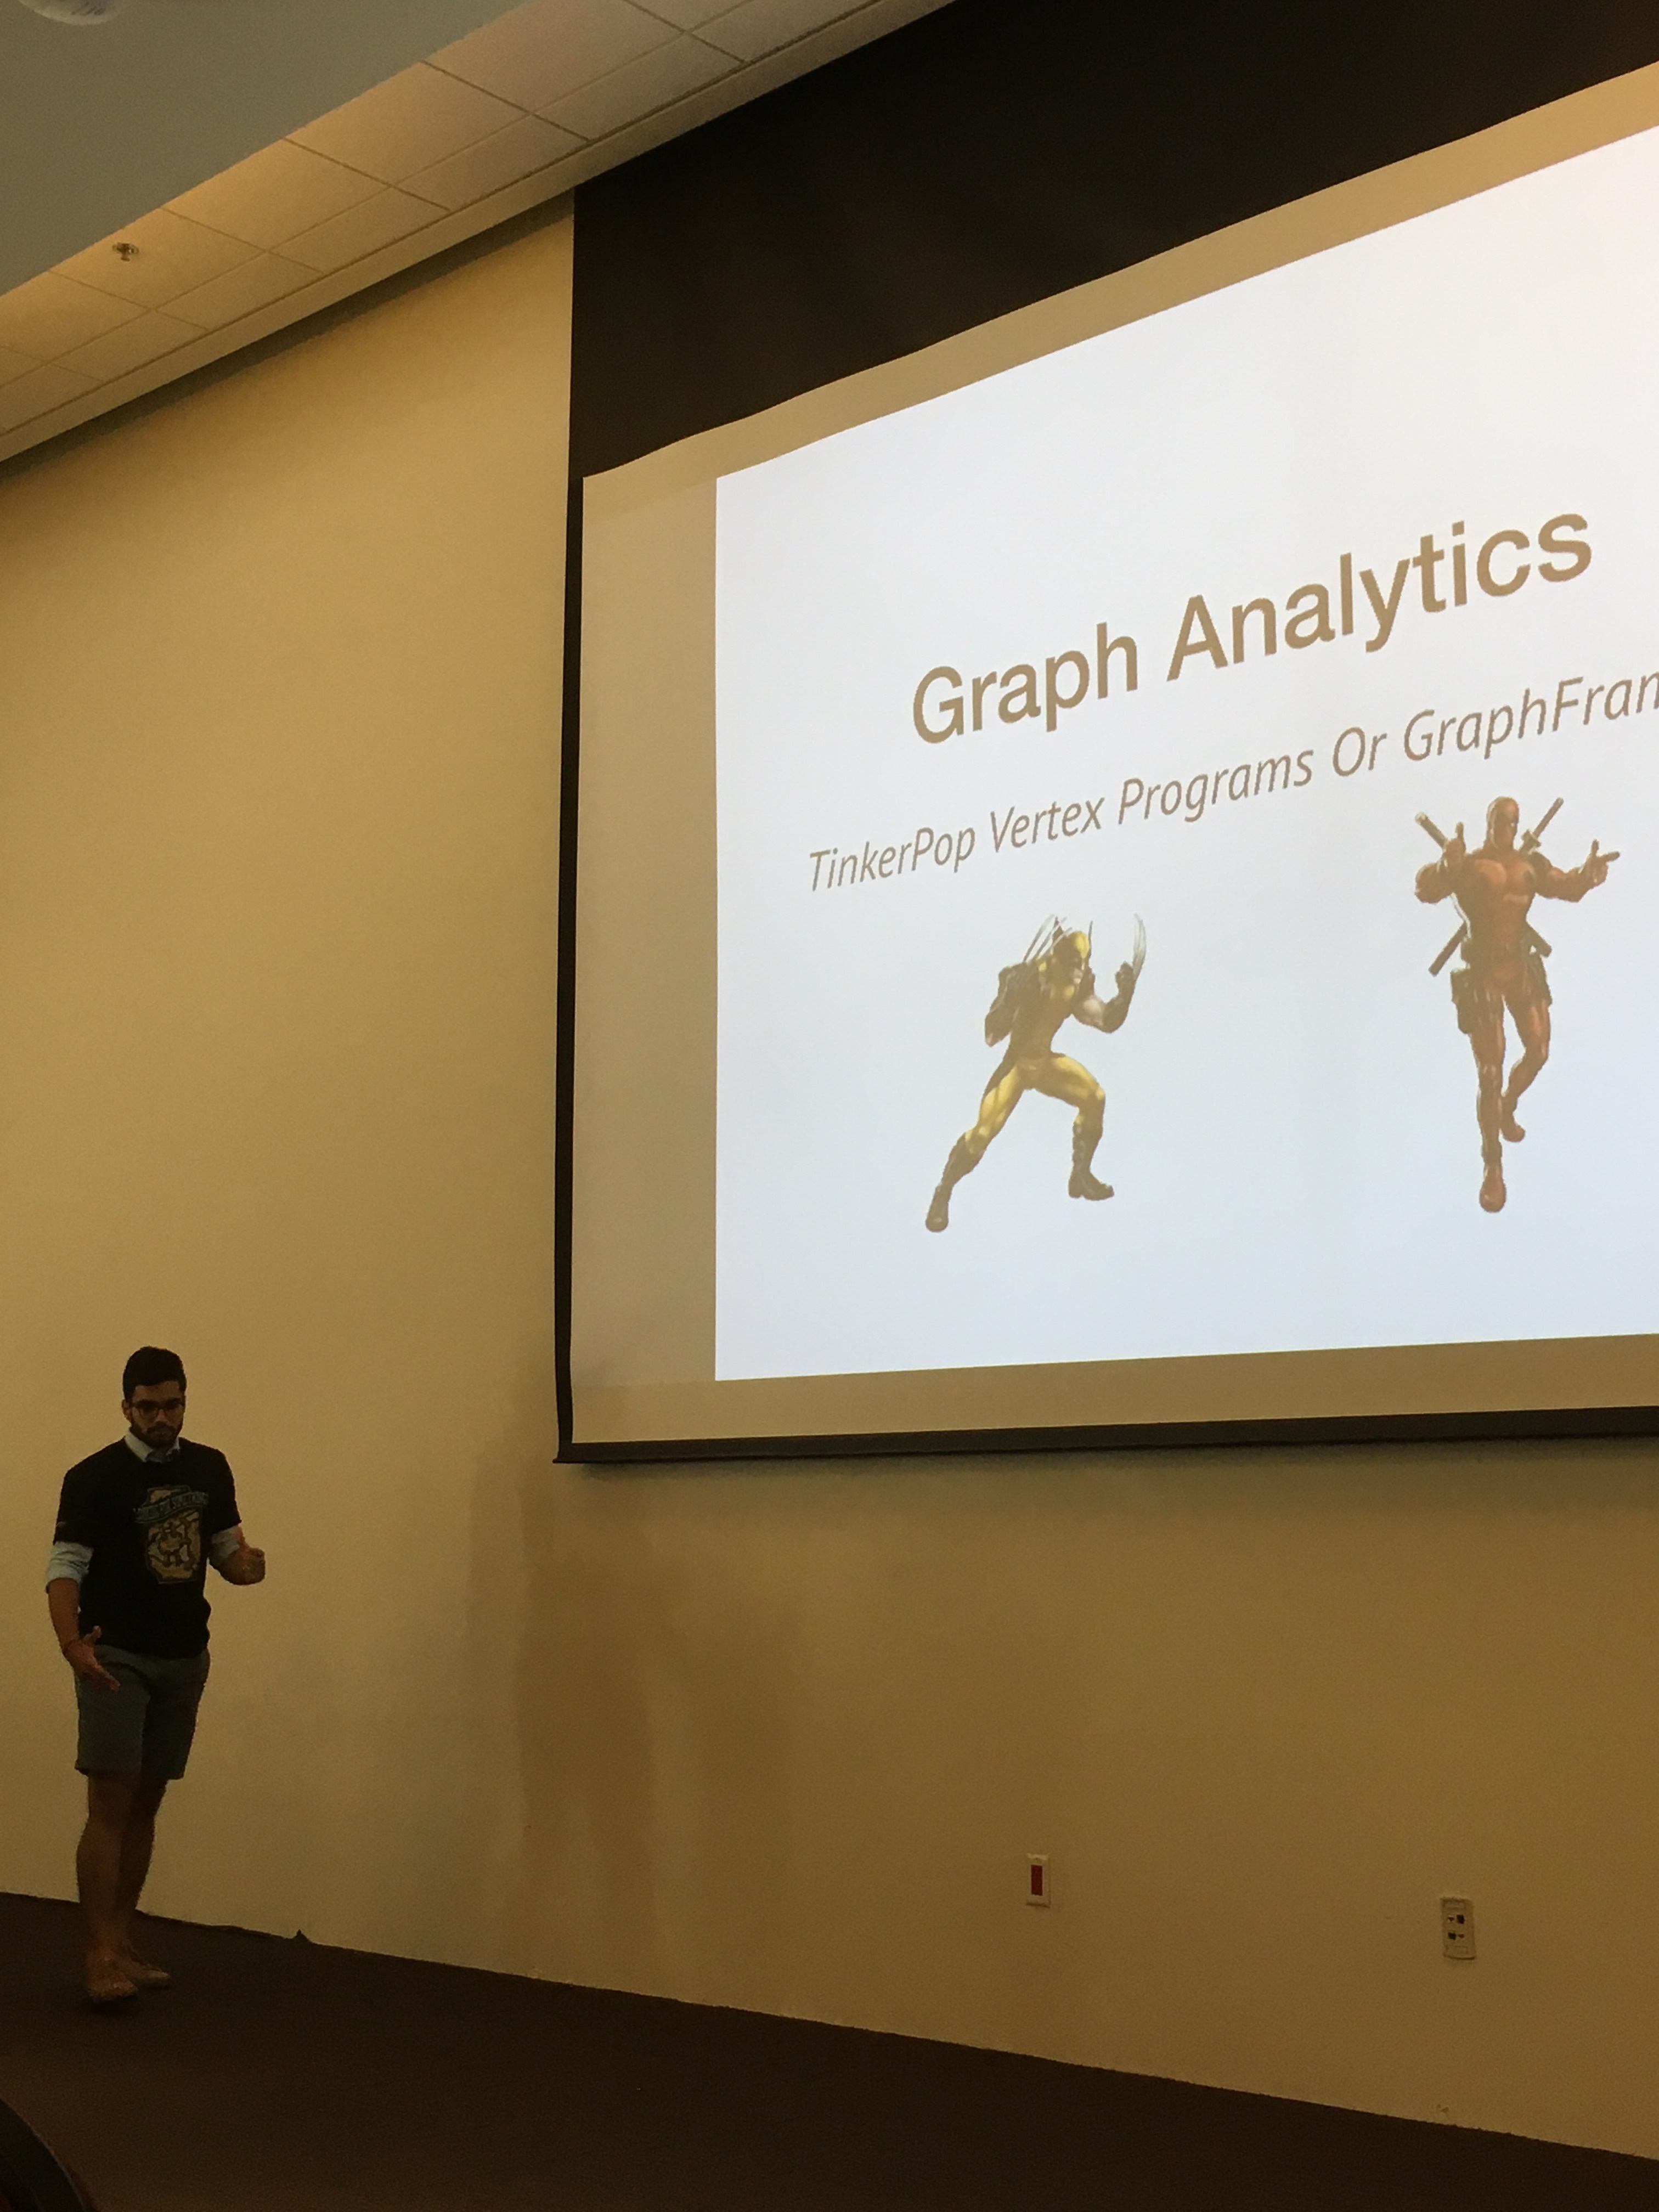
Vertex Programs or GraphFrames? Two approaches to Graph Analytics: Paras Mehra
Paras' talk was a comparison of TinkerPop Vertex Programs vs GraphFrames. There are many graph analytics frameworks out there and many are open-sourced, but which one do you pick?
Paras focused on utilizing TinkerPop and GraphFrames since they utilize the power of Apache Spark, are easy to use by developers and make it easy to get started. GraphFrames are an API on top of Spark that allow Graph datasets to be used similarly to DataFrames. Once your dataset is in a graphframe you have the power to apply graph algorithms to these datasets easily.
Paras, like Jim, was fearless and prepared to run a live demo! Paras showed a demo with PageRank, which was invented by Larry Page (Google) to measure the number of edges to a node and the relative importance of those neighboring nodes. PageRake has been implemented in TinkerPop VertexProgram and GraphFrames. From Paras' experimentation, he was able to show that TinkerPopVP was significantly faster at executing PageRank than GraphX and GraphFrames on a midsized graph (50K nodes and 3K edges). Naturally, the next step was to increase the size of the graph and see if these conclusions still held true. Paras took a Twitter dataset of twitter users and followers (41 million nodes, and 1.5 billion edges) and tried to run PageRank to get his results. That job is still running on all frameworks. Hopefully, once he gets his final answer he will post it here in the comments!
Also check out these awesome demos on github: Github for pmehra7
Check out the Distributed Data Shows featuring Dr. Gosnell live at Graph Day here: Graph Day Interview with Dr. Gosnell
Check out Dr. Gosnell's Keynote here: From Theory To Practice Presented by Dr. Gosnell
All other talks from Graph Day will also be posted to our Youtube channel, so subscribe so you don't miss a thing!
Graph Day 2018
Keynote - From Theory to Production: Dr. Denise Gosnell
Data Modeling with an FU to Super Nodes: Jonathan Lacefield
Comparing GraphFrames access methods in DSE Graph: Jim Hatcher
How Do *You* Graph? - Minimizing Developer Impedance: Ben Krug
Vertex Programs or GraphFrames? Two approaches to Graph Analytics: Paras Mehra
More Company
View All
London Called. RAG++, The AI Event, Answered!
DataStax Named a Leader in The Forrester Wave™: Vector Databases, Q3 2024

Live From New York! It’s RAG++, The AI Event