

I have a background in software development, not QA. When I started at DataStax, as a test engineer for Cassandra, I was new to both Cassandra and testing strategies in general. I'd like to showcase several tools that I have found invaluable in my day-to-day testing with the hope that you may also find a use for these tools in troubleshooting your own installations.
Disk I/O
It's no secret that Cassandra loves hard drives and solid state disks. The more you have, and the faster they are, the better your cluster will perform. But how can you tell how well your disks are being used? Is your application hitting an I/O bottleneck? Or, does it have problems elsewhere?
Before you can know whether Cassandra is efficiently using your disks, it's important to establish how fast your disks are in a controlled environment. hdparm will give you an upper bound (best case). Because hdparm accesses the drive at the block level, rather than the filesystem level, this number will be much faster than any real-world numbers. But, it gives you a baseline that you can test against later to see whether your drive performance drops over time:
$ sudo hdparm -t /dev/sda
/dev/sda:
Timing buffered disk reads: 1400 MB in  3.00 seconds = 466.59 MB/sec
hdparm will give you only read statistics. You can test with dd for writes. Doing so against the block device (/dev/sda in our example) would destroy the filesystem, but you can also test against a regular file (which is a slightly different test, due to filesystem overhead):
$ sync;time bash -c "(dd if=/dev/zero of=bf bs=8k count=500000; sync)";rm bf
500000+0 records in
500000+0 records out
4096000000 bytes (4.1 GB) copied, 12.9855 s, 315 MB/s

real    0m13.578s
user    0m0.030s
sys    0m4.010s
Both hdparm and the dd hack above are quick ways to do sanity checks on drives, but they are not exhaustive benchmarking tools. You should use a tool such as iozone or bonnie++ for more rigorous testing of filesystem-level performance. Even better than that would be to record known baselines with Cassandra itself and check them periodically.
iostat is a tool that you can use to measure real-world drive performance by giving you kernel-level statistics about how much activity there is on your disks during any given time period. We can use this tool to measure disk performance of Cassandra.
Without any arguments, iostat outputs something like this:
avg-cpu:  %user   %nice %system %iowait  %steal   %idle
           3.45    0.80    0.85    0.12    0.00   94.79

Device:            tps    kB_read/s    kB_wrtn/s    kB_read    kB_wrtn
sda              11.42        55.04       422.19   52195184  400364207
The last line tells us stats for the disk we're testing (sda). The third and fourth columns tell us the average KBps the drive read and wrote during the time frame specified. Because we didn't give any arguments to iostat, the time frame starts when the system was first booted. Usually, this is the wrong time frame for testing Cassandra.
Instead, here's the command I like to use:
$ iostat -x -m -t -y -z 30 | tee iostat.log
09/29/2013 11:50:54 AM
avg-cpu:  %user   %nice %system %iowait  %steal   %idle
           3.76    0.96    1.16    0.10    0.00   94.02

Device:         rrqm/s   wrqm/s     r/s     w/s    rMB/s    wMB/s avgrq-sz avgqu-sz   await r_await w_await  svctm  %util
sda               0.00     0.00    0.00   12.20     0.00     0.13    22.49     0.00    0.36    0.00    0.36   0.33   0.40
This will output stats once every 30 seconds, until you kill it, logging to a file called iostat.log. The stats are expressed in MBps (-m), which is easier for me to read, and outputs the time (-t), which makes it easier to correlate the iostat numbers to events recorded in Cassandra's log. The report is extended (-x), giving us some additional interesting numbers, like %util. This is the saturation of the device - how long the CPU is waiting for this device to complete tasks. It's good to watch this number as it can indicate your application is I/O blocked.
Memory Analysis
The Java heap is a limited resource. Even if you have a ton of RAM, due to the way Java (currently) handles garbage collection, it's not recommended to use more than 8GB for your heap. Therefore, in testing your application, it's often useful to know how Cassandra is managing that finite resource.
Cassandra turns on JMX by default, so you can connect to any running node with jconsole. The memory tab shows you the current heap size. It's good to click the 'Perform GC' button if you want to see what the heap size is after garbage collection.
You can also do the same on the command line with jmxterm. This is often more convenient to run on a remote server, because you will not have to open up any ports for a remote jconsole. Here's how to grab the heap size, run the garbage collector, and see the change:
$ jmxterm
$>open localhost:7100
#Connection to localhost:7100 is opened
$>get -b java.lang:type=Memory HeapMemoryUsage
#mbean = java.lang:type=Memory:
HeapMemoryUsage = {
  committed = 2036334592;
  init = 2078277632;
  max = 2036334592;
  used = 985375216;
 };

$>run -b java.lang:type=Memory gc
#calling operation gc of mbean java.lang:type=Memory
#operation returns:
null

$>get -b java.lang:type=Memory HeapMemoryUsage
#mbean = java.lang:type=Memory:
HeapMemoryUsage = {
  committed = 2036334592;
  init = 2078277632;
  max = 2036334592;
  used = 136428896;
 };
However, just knowing the heap size doesn't give us any better insight into what is actually consuming the memory. For that, we need a heap dump.
If your Cassandra node dies due to an OutOfMemoryError, a heap dump is created for you in the directory where it's run. If not, you need to create your own:
$ jmap -dump:format=b,file=heap.bin `pgrep -f CassandraDaemon`
Dumping heap to /home/ryan/heap.bin ...
Heap dump file created
The heap dump created is a snapshot in time of the memory usage of Cassandra. You can analyze it at your leisure, even on a machine different from the one running Cassandra. One of the best tools for heap dump analysis is the Eclipse Memory Analyzer Tool (MAT).
MAT is a GUI tool, so you need to transfer your heap dump to the machine where you're going to run it. If you're running a big node, the heap dump will probably be 8GB uncompressed. If you're debugging a remote node, that's a lot of data to transfer, so I usually use X11 forwarding and run MAT directly on the machine I'm debugging.
If you open your heap dump in MAT, the first screen you'll see is an overview of the largest Java objects in memory, like this:

That's a lean and happy Cassandra. An unhealthy, unhappy Cassandra looks like this:
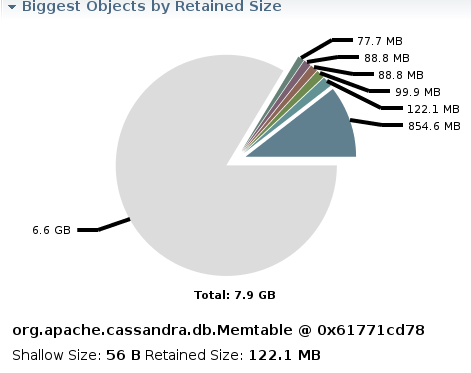
This was from a test where I was pushing the limits of total number of column families. (In this case, the node ran out of memory.)
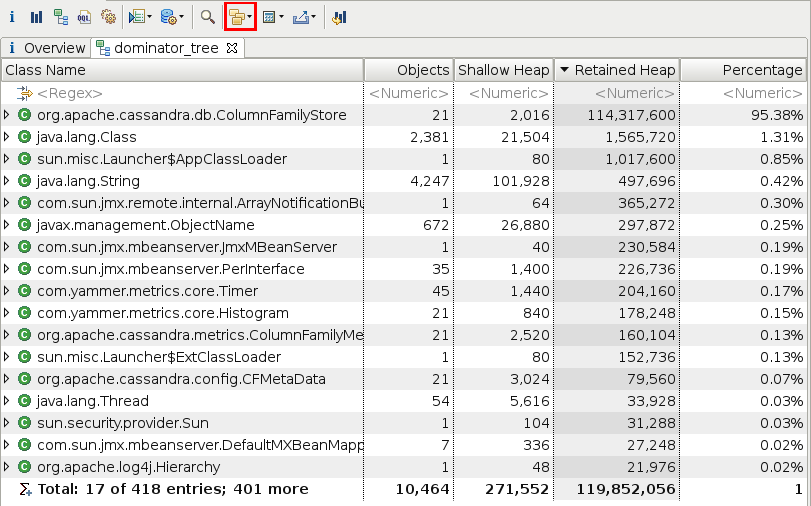
This chart gives you only the biggest objects, but in reality your memory hog may be lots of little objects of the same type. To find those, open up the Dominator Tree. Set the 'Group by' field (outlined in red below) to 'class' and then sort the results by Retained Heap to show the largest collection of classes:
Monitoring Cassandra
If you haven't read the C* wiki page on Monitoring Cassandra, you should. 'nodetool tpstats', in particular, is an easy way to see the active and pending tasks of your cluster. If you see the numbers in the Pending column climb, you've got some problems to resolve. You can start to see some interesting patterns in these numbers: one thread blocking will affect another a few seconds later.
Visualization
The most important lesson I've learned in testing Cassandra has been that beyond collecting raw statistics, it's important to be able to visualize your data. My pre-bionic eyes are not well tuned to reading thousands of lines in a log file, or seeing the aberrations in cassandra-stress output. I need to be able to see this data in a visual manner in order to be able to derive useful information from it.
It's also useful to share your findings with others. People with other skillsets will find things that you overlook. Making your data as easy to read as possible will get you the most valuable feedback. D3.js is a javascript toolkit that can help you visualize your collected data. It's not really a graphing library per se; it's more low level than that, but it's easily the best tool I know of for creating great-looking charts, in the browser, that are then easily shared with others.
At DataStax, I've used D3.js to help visualize a number of bugs that would otherwise be difficult for me to understand. For instance, here is a read performance bug found when using eager retry in Cassandra 2.0. Finding this bug required running several benchmarks on various git branches, with many different parameters. If I had examined only the aggregate statistics of these runs, I might not have ever seen the error. If I looked at the text-based intervals spit out by cassandra-stress, I would be looking at only a single run. By taking these sets of data and combining them into a single chart, we can see the relative disparities between them:
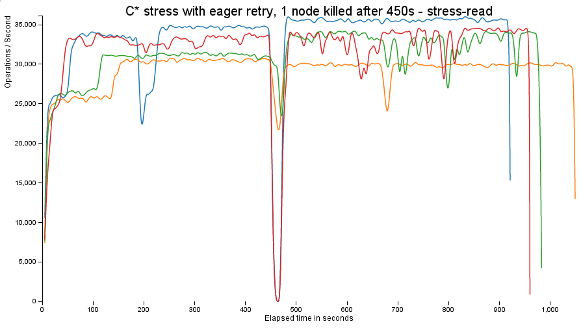
The giant drop in performance in the middle of that graph is due to a deliberate killing of a single a C* node. Each test records a duration of time where the ops/second drops, along the lines of:
14257638.0, 34315.0, 34315.0, 0.8, 4.2, 37.5, 449.0
14298654.0, 8203.0, 8203.0, 0.8, 4.1, 37.5, 454.0
14298654.0, 0.0, 0.0, 0.8, 4.1, 37.5, 459.0
14298654.0, 0.0, 0.0, 0.8, 4.1, 37.5, 464.0
14298654.0, 0.0, 0.0, 0.8, 4.1, 37.5, 469.0
14442091.0, 28687.0, 28687.0, 0.7, 4.1, 37.2, 474.0
14621303.0, 35842.0, 35842.0, 0.7, 4.1, 36.8, 479.0
The zeros in the second and third columns are easily missed when scanning through a log but become obvious with a visual graph.
Leaders like Barracuda and Temporal manage Apache Cassandra® with Astra DB. You can too.
Create a ClusterDisk I/O
Memory Analysis
Monitoring Cassandra
Visualization
More Technology
View All

Simplifying Ground Truth Generation for LLMs

