
I recently wrote about how not to benchmark Cassandra and some of the principles involved in benchmarking Cassandra and other databases correctly. Let’s take a look at how to apply these to a benchmark done by Thumbtack Technology for Aerospike.
First, the basics: this test was done on bare metal machines, with SSD disks. The benchmark report doesn’t make it entirely clear how load generation was done, but Thumbtack’s github repository shows efforts made to parallelize YCSB across multiple load generators with Fabric, so absent any red flags I’m inclined to think they got this right, too.
Our problems start with benchmark hygiene: the read runs were run one after the other rather than properly isolating them by dropping the page cache and warming up each workload separately. It also looks like no effort was made to isolate the effects of Cassandra compaction; compaction from the read/write workload could have continued into the read-heavy section. (More on this below.)
But that’s small potatoes compared to the really big one: this benchmark absolutely measures different things in each tested system. This is evident on both the insert and read-heavy workloads.
Read-heavy workload
Let’s start with the read-heavy workload, since it’s so simple:
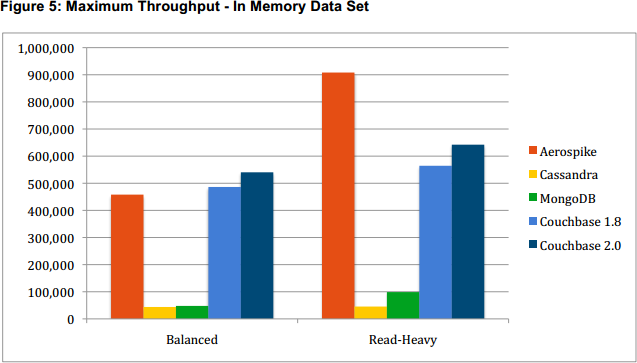
Straightforward enough, until you get to the fine print: “Cassandra’s cache hit ratio was about 35% for the balanced workload and 70% for the read-heavy workload.” In other words: not actually in memory!
There are two factors influencing this. First, Cassandra does optimize for larger-than-memory data sets, often much larger. For in-memory workloads before Cassandra 2.1, you need to configure the populate_io_cache_on_flush setting to explicitly keep newly-flushed data files hot.
But this is a negligible factor in the read-heavy workload. Either Cassandra’s overhead per row is higher than Aerospike and Couchbase, or compaction from the prior balanced workload was still ongoing. Based on my understanding of the Couchbase and Cassandra storage engines I would expect similar overhead on top of the data stored, so my guess is that ongoing compactions were responsible.
Insert workload
Red flags go off immediately when I look the insert numbers: since Cassandra writes are basically just appending to the commitlog, it’s very fishy that Aerospike and Couchbase are 4x-5x faster:
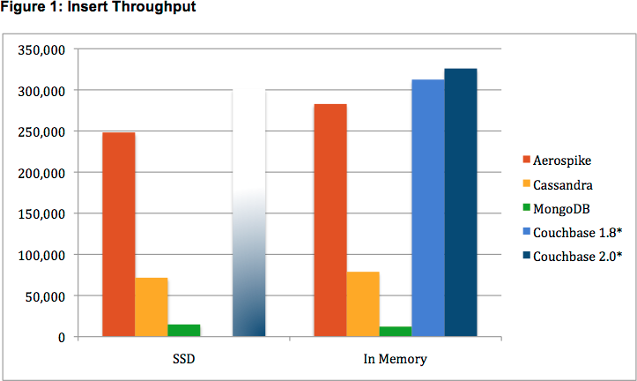
Either Cassandra’s commitlog metadata is 4x larger than the data being written (it’s not), or something fishy is going on. Sure enough, Thumbtack left each system running with its default write model, and the systems not actually writing to disk post better numbers:
-
Cassandra writes synchronously to its commitlog, which is fsync’d by default every 10s
-
MongoDB writes to its journal (similar to Cassandra’s commitlog), fsync’d every 100ms.1
-
Couchbase buffers writes in memory and writes to disk asyncronously later. This is virtually identical to pre-journal, pre-safe-mode MongoDB behavior.
-
Aerospike is closed source and I could find no relevant public information about write durability on disk. From the performance numbers it’s almost certainly doing Couchbase-style asynchronous buffering.
Note that there is some language around doing synchronous vs asynchronous writes in the Thumbtack report. This refers to synchronous replication, not on-disk durabililty. It’s important to match the behavior of both to get valid results.
A quick sanity check
Unfortunately, the Aerospike API has changed sufficiently that Thumbtack’s YCSB client no longer builds, so I substituted HBase to round out the top four scalable NoSQL databases. Here’s what I saw on a single-server test 2 when I standardized all systems3 on synchronously durable writes:
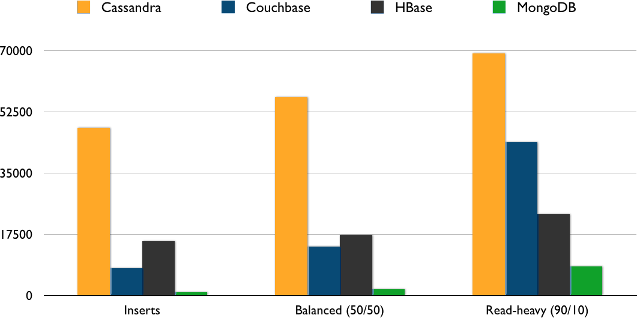
(Like Thumbtack and other Couchbase users, we couldn’t actually get Couchbase to work with a larger than memory dataset. We stuck with the largest dataset we could get to work, of 50M rows.)
Given the quick-and-dirty nature of these numbers, I will resist the urge to read much into them other than to point out that the days are long past when you could stereotype Cassandra as slow at reads.
Credit where it’s due
Many benchmarks are clearly reporting nonsense but don’t provide enough detail on methodology to determine why. Thumbtack’s report was thorough, and the work they contributed to YCSB allows anyone to reproduce their results, or run alternative scenarios as I have done.
I’ve merged Thumbtack’s changes with my own fixes and a Cassandra CQL client to my YCSB github repository.
1 Early releases of MongoDB became notorious for buffering writes in memory and writing to disk asynchronously; writing to the journal synchronously was made the default in MongoDB drivers as of November 2012. Thumbtack does not specify the driver version used, but YCSB has always forced safe mode by default, which matches the performance Thumbtack recorded.
2 2x Intel E5620, 32GB ram, 7 7200 rpm disks in RAID 0
3 Cassandra 2.1rc1, Couchbase 2.5.1, HBase 0.98.3, MongoDB 2.6.1
Leaders like Barracuda and Temporal manage Apache Cassandra® with Astra DB. You can too.
Create a ClusterRead-heavy workload
Insert workload
A quick sanity check
Credit where it’s due
More Company
View All
Shaping the Wild in Las Vegas: An AWS re:Invent Recap

Announcing 12 Days of Codemas: The DataStax Holiday Giveaway!

London Called. RAG++, The AI Event, Answered!