DataStax Enterprise 5.0 introduces DSE Graph, the first massively scalable and high performance graph database, as part of the adaptive data model support required today by all modern cloud applications.
Together with OpsCenter 6.0 and the new DataStax Enterprise Drivers, we are thrilled to release the first version of DataStax Studio, an intuitive web-based application for querying, exploring, analyzing, and visualizing graph data. DataStax Studio has been designed from the ground up to satisfy the needs of architects, developers, and data scientists using DSE Graph.
DataStax Studio is a feature-rich and friendly learning tool that will help you quickly become a DSE Graph expert. DataStax Studio is also a super productive environment for seasoned graph developers and data analysts that will help visually uncover information needed to make critical operation and business decisions.
Without further ado, here is a sneak peek at the features of DataStax Studio that I’m most excited about.
The most advanced Gremlin editor for DSE Graph
Learning new APIs is part of our daily jobs, but becoming proficient and then mastering a fairly large domain specific language like Gremlin takes time. A smart editor can help a lot in this journey by making intelligent suggestions at every step and ensuring that the queries you are writing are error free. DataStax Studio comes with an intelligent code editor for Gremlin that offers code completions, schema completions, and a wide range of validations. We will publish soon an in-depth article about the features of the Gremlin editor, but until then, I can tell you that it’s amazing:

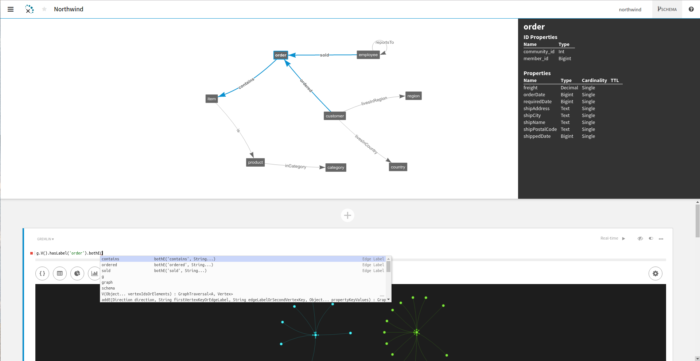
Whiteboard your Graph Schema
Knowing at all times the schema of your DSE graph can be very helpful to ensure the correctness and efficiency of your queries, but also for exploring and validating different hypothesis about your data. DataStax Studio provides a whiteboard-like view of your graph vertexes, edges, and properties revealing the graph organization and connections:
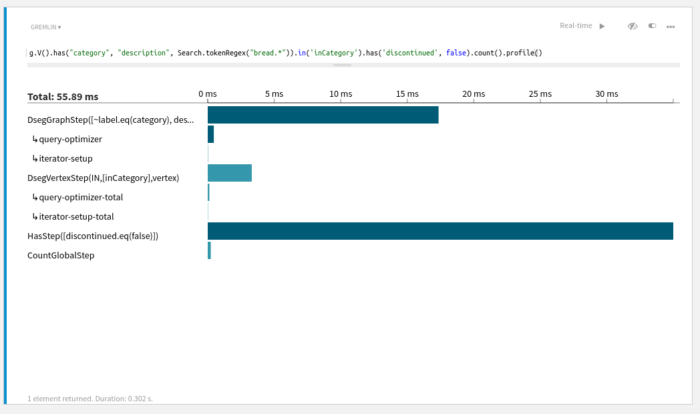
Query profiler
Writing correct queries is just the first step. Next comes making sure that these queries are as efficient and performant as required. This is where the profiler view included in DataStax Studio helps by providing you with the execution details of a query:
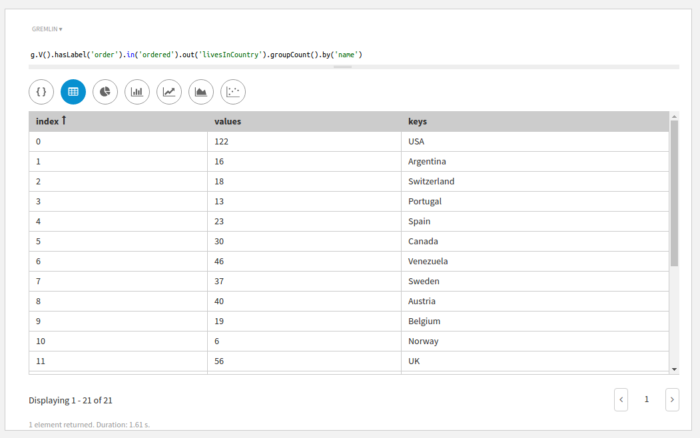
Visualize Graph data the way you want
Once your error free queries are in place, it’s time to see and work with the results. DataStax Studio comes with support for numerous output formats and visualizations. While not as visually appealing as their siblings, but still useful, we have first the grid, JSON, and plain text viewers:
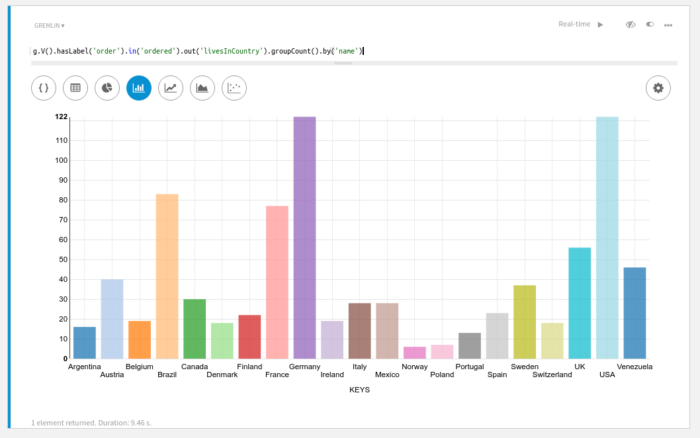
Next, DataStax Studio also supports a series of commonly used charts: pie, bar, line, area, scatter:
Last, but definitely the nicest looking, the graph view:
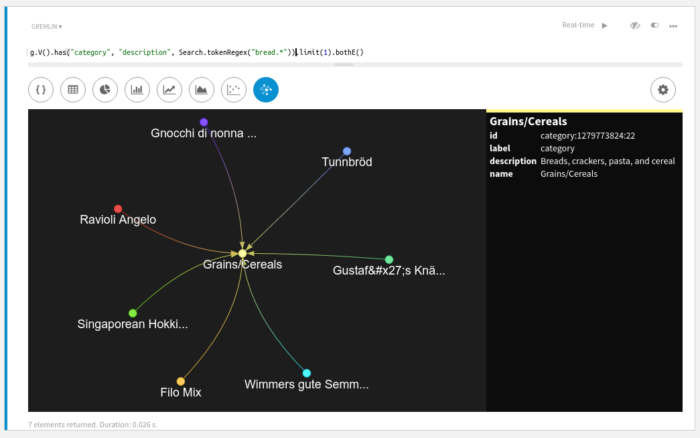
The graph view allows you to click around to see details about vertices and edges, zoom in and out, and also drag elements around for getting the best view on your DSE graph data.
Try DataStax Studio 1.0 Today
Summarizing, DataStax Studio 1.0 provides:
- The most intelligent Gremlin editor on the market
- A rich set of data visualizations and numerous output formats that can be used to surface insight from data and present it in the most telling and beautiful formats
- An interaction model that makes it a great solution for anything from learning to creating amazing self-documented, executable data-driven documents that uncover information needed to make critical business and operational decisions
There are many other exciting features in DataStax Studio, but I’d encourage you to download and try it yourself. We are looking forward to hearing your feedback studio-feedback@datastax.com.

