Common Spark Troubleshooting

(Note: While most of this is geared towards DataStax Enterprise Spark Standalone users, this advice should be applicable to most Apache Spark users as well!)
Update 2015-06-10: As a follow-on to this blog post, see Zen and the Art of Spark Maintenance which dives deeper into the inner workings of Spark and how you can shape your application to take advantage of interactions between Spark and Cassandra.
Initial job has not accepted any resources : Investigating the cluster state
This is by far the most common first error that a new Spark user will see when attempting to run a new application. Our new and excited Spark user will attempt to start the shell or run their own application and be met with the following message
WARN TaskSchedulerImpl: Initial job has not accepted any resources; check your cluster ui to ensure that workers are registered and have sufficient memory
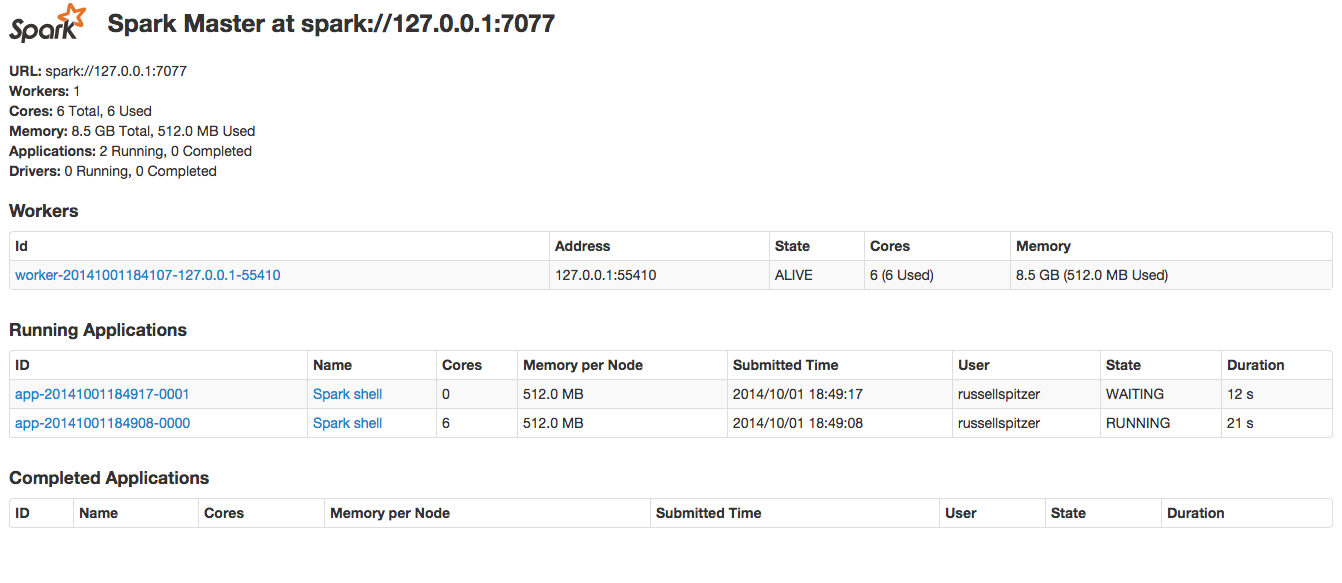
This message will pop up any time an application is requesting more resources from the cluster than the cluster can currently provide. What resources you might ask? Well Spark is only looking for two things: Cores and Ram. Cores represents the number of open executor slots that your cluster provides for execution. Ram refers to the amount of free Ram required on any worker running your application. Note for both of these resources the maximum value is not your System's max, it is the max as set by the your Spark configuration. To see the current state of your cluster (and it’s free resources) check out the UI at SparkMasterIP:7080 (DSE users can find their SparkMaster URI using dsetool sparkmaster.)

In the above example is a picture of my Spark UI running on my Macbook (localhost:7080). You can see one of the Spark Shell applications is currently waiting. I caused this situation by starting the Spark Shell in 2 different terminals. The first Spark shell has consumed all the available cores in the system leaving the second shell waiting for resources. Until the first spark shell is terminated and its resources are released, all other apps will display the above warning. For more details on how to read the Spark UI check the section below.
The short term solution to this problem is to make sure you aren’t requesting more resources from your cluster than exist or to shut down any apps that are unnecessarily using resources. If you need to run multiple Spark apps simultaneously then you’ll need to adjust the amount of cores being used by each app.
Application isn’t using all of the Cores: How to set the Cores used by a Spark App
There are two important system variables that control how many cores a particular application will use in Apache Spark. The first is set on the Spark Master, spark.deploy.defaultCores. You can set this as -Dspark.deploy.defaultCores in the command line of your Spark Master startup script (In DSE look in resources/spark/conf/spark-env.sh). This option will set the default number of cores to be used by all applications started through this master. This means that if I had set spark.deploy.defaultCores=3 in my above example everything would have been fine. Each Spark Shell would have reserved 3 cores for execution and the two jobs could run simultaneously.
The second variable for controlling number of cores allows us to override the master default and set the number of cores on a per app basis. This variable, spark.cores.max, can be set programmatically or as a command line JVM option. Programmatically it is set by adding a key-value pair to the SparkConf object used for creating your spark context. On the command-line it is set using -Dspark.cores.max=N.
Spark Executor OOM: How to set Memory Parameters on Spark
Once an app is running the next most likely error you will see is an OOM on a spark executor. Spark is an extremely powerful tool for doing in-memory computation but its power comes with some sharp edges. The most common cause for an executor OOM’ing is that the application is trying to cache or load too much information into memory. Depending on your use case there are several solutions to this:
- Increase the parallelism of your job. Try increasing the number of partitions in your job. By splitting the work into smaller sets of data less information will have to be resident in memory at a given time. For a Spark Cassandra Connector job this would mean decreasing the split size variable. The variable, spark.cassandra.input.split.size, can be set either on the command line as above or in the SparkConf object. For other RDD types look into their api’s to determine exactly how they determine partition size.
- Increase the storage fraction variable, spark.storage.memoryFraction. This can be set as above on either the command line or in the SparkConf object. This variable sets exactly how much of the JVM will be dedicated to the caching and storage of RDD’s. You can set it as a value between 0 and 1, describing what portion of executor JVM memory will be dedicated for caching RDDs. If you have a job that will require very little shuffle memory but will utilize a lot of cached RDD’s increase this variable (example: Caching an RDD then performing aggregates on it.)
- If all else fails you may just need additional ram on each worker. For DSE users adjust your spark-env.sh (or dse.yaml file in DSE 4.6) file to increase SPARK_MEM reserved for Spark jobs. You will need to restart your workers for these new memory limits to take effect (dse sparkworker restart.) Then increase the amount of ram the application requests by setting spark.executor.memory variable either on the command line or in the SparkConf object.
Shark Server/ Long Running Application Metadata Cleanup
As Spark applications run they create metadata objects which are stored in memory indefinitely by default. For Spark Streaming jobs you are forced to set the variable spark.cleaner.ttl to clean out these objects and prevent an OOM. On other long lived projects you must set this yourself. For those users of Shark Server this is especially important. For DSE users (4.5.x) you can set this property in your shark-env.sh file for Shark Server deployments. This will let you have a long running Shark processes without worrying about a sudden OOM. To check if this issue is causing your OOMs look in your heap dumps for a large number of scheduler.ShuffleMapTasks and scheduler.ResultTask objects.
To set this you would end up modifying your SPARK_JAVA_OPTS variable like this export SPARK_JAVA_OPTS +="-Dspark.kryoserializer.buffer.mb=10 -Dspark.cleaner.ttl=43200"
Class Not Found: Classpath Issues
Another common issue is seeing class not defined when compiling Spark programs this is a slightly confusing topic because spark is actually running several JVM’s when it executes your process and the path must be correct for each of them. Usually this comes down to correctly passing around dependencies to the executors. Make sure that when running you include a fat Jar containing all of your dependencies, (I recommend using sbt assembly) in the SparkConf object used to make your Spark Context. You should end up writing a line like this in your spark application:
val conf = new SparkConf().setAppName(appName).setJars(Seq(System.getProperty("user.dir") + "/target/scala-2.10/sparktest.jar"))
This should fix the vast majority of class not found problems. Another option is to place your dependencies on the default classpath on all of the worker nodes in the cluster. This way you won't have to pass around a large jar.
The only other major issue with class not found issues stems from different versions of the libraries in use. For example if you don't use identical versions of the common libraries in your application and in the spark server you will end up with classpath issues. This can occur when you compile against one version of a library (like Spark 1.1.0) and then attempt to run against a cluster with a different or out of date version (like Spark 0.9.2). Make sure that you are matching your library versions to whatever is being loaded onto executor classpaths. A common example of this would be compiling against an alpha build of the Spark Cassandra Connector then attempting to run using classpath references to an older version.
What is happening : A Brief Tour of The Spark UI
Once your job has started and it’s not throwing any exceptions you may want to get a picture of what's going on. All of the information about the current state of the application is available on the Spark UI. Here is a brief walkthrough starting with the initial screen>.
If you are running on AWS or GCE you may find it useful to set SPARK_PUBLIC_DNS=PUBLIC_IP for each of the nodes in your cluster. This will cause make the links work correctly and not just connect to the internal provider IP addresses.

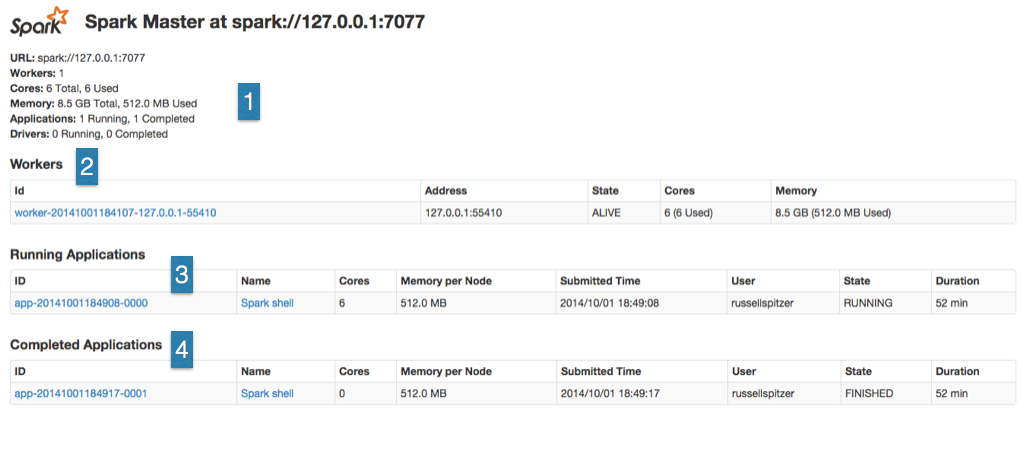
You should see something very similar to this when accessing the UI page for your spark cluster. In the upper left (1) you’ll see the cluster wide over statistics showing exactly what resources are available. These numbers are aggregates for all of the workers and running jobs in the cluster. Starting at the Workers line (2) we’ll see what action is actually taking place on our cluster at the moment.
First listed is exactly what workers are currently running and how utilized they are. You can see here on a node by node basis how much memory is free and how many cores are available. This is significant because the upper bound on how much memory an application can use is set at this level. For example a job which requests 8 GB of ram can only run on workers which have at least 8 GB of free ram. If any particular node has hung or is not appearing on the worker list try running dsetool sparkworker restart on that node to restart the worker process. (Note: you may see dead workers on this page if you have recently restarted nodes or spark worker processes, this is not an issue the master just hasn’t fully confirmed that the old worker is gone.)
Below we that we can see the currently running spark applications (3). Since I’m currently running an instance of the Spark Shell you can see an entry for that listed as running. A line will appear here for every Spark Context object that is created communicating with this master. Since the spark context for the Spark Shell is created on startup and doesn’t close until the shell is closed, we should see this listed as long as we are running Spark Shell commands. In the Completed Applications section (4), we can see I’ve shut down that Spark Shell from earlier that was waiting for resources.
In Spark 1.0+ you can enable event logging which will enable you to see the application detail for past applications but I haven’t for this example. This means we can only look into the state of currently running applications. To peek into the app we can click on the applications name (“Spark shell” directly to the right of the 3) and we’ll be taken to the App Detail page.

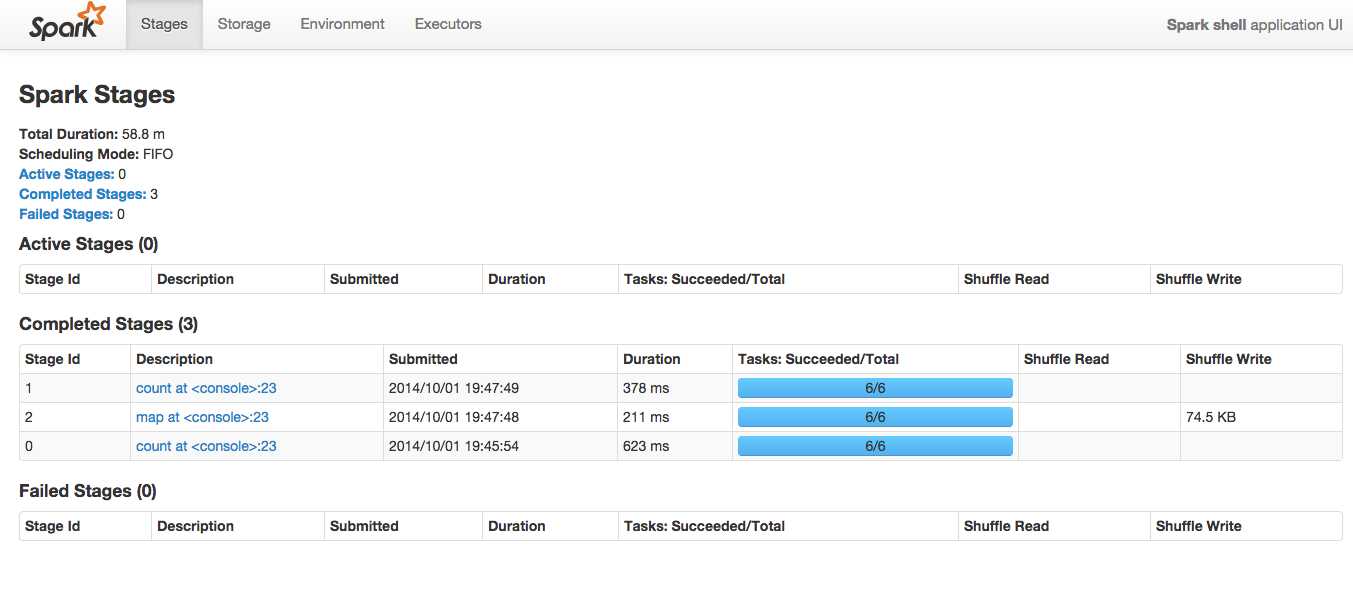
Here we can see the various Stages that this application has completed. For this particular example I’ve run the following commands.
sc.parallelize(1 until 10000).count
sc.parallelize(1 until 10000).map( x => (x%30,x)).groupByKey().count
You can see each Spark Transformation (map) and Action (count) is reported as a separate stage. We can see that in this case, each of the stages has already completed successfully. We can see for each stage exactly how many Tasks it was broken into and how many of them are currently complete. The number of Tasks here is the maximum level of parallelism that can be accomplished for that stage. The Tasks will be handed out to available executors, so if there are only 2 tasks but 4 executors (cores) then that stage can only ever be run on 2 cores at the same time. Adjusting how many tasks are created is dependent on the underlying RDD and the nature of the transformation you are running, be sure to check your RDD’s api to determine how many partitions/tasks will be created. To actually see the details on how a particular stage was accomplished click on the “Description” field for that stage to go to the Stage Detail page.

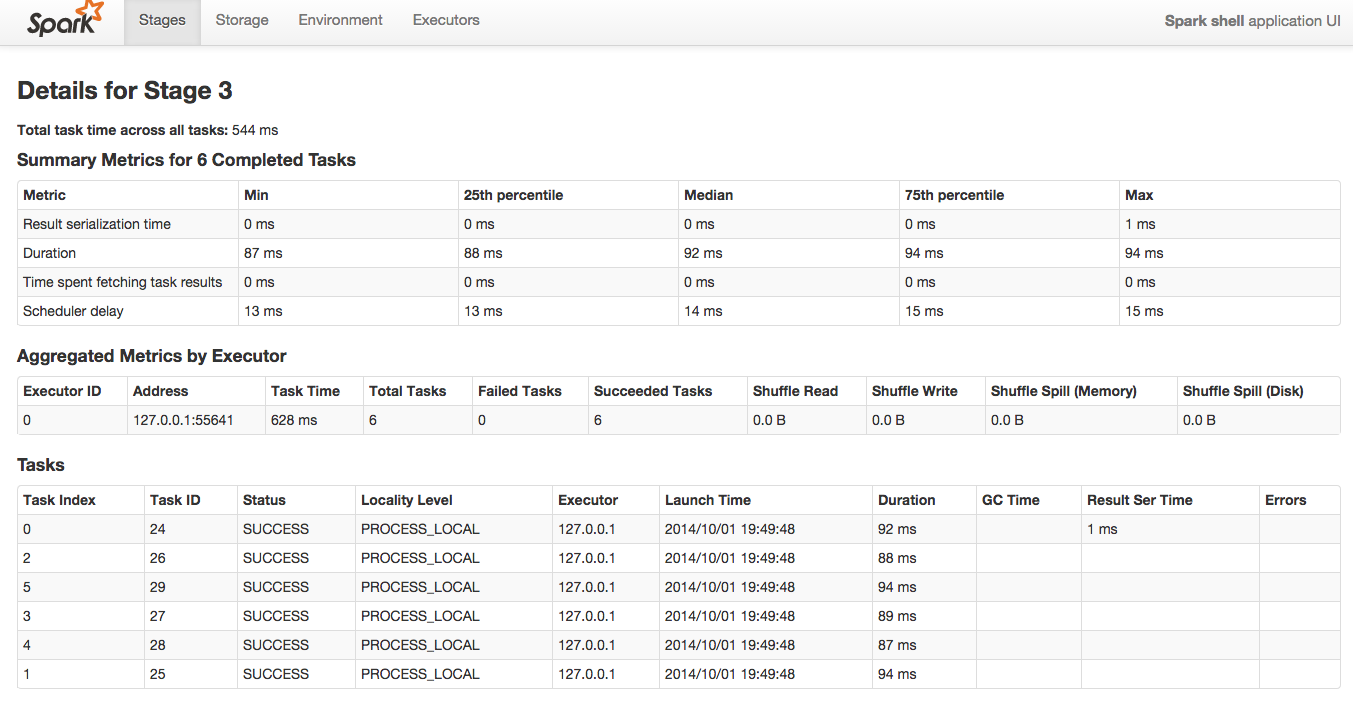
This page gives us the nitty gritty of how our stage was actually accomplished. At the bottom we see a list of every task, on what machine/or core it was run and how long it took. This is a key place to look to find tasks that failed, on what node they failed and get information about where bottlenecks are. The Summary at the top of the page shows us the summary of all of the entries of the bottom of the page, making it easy to see if there are outliers that may have been running slow for some reason. Use this page to debug performance issues with your tasks.
Let’s take a quick detour to the “Storage Tab” at the top of this screen. This will take us to a screen which looks like this.

Here we can see all the RDD’s currently stored and by clicking on the “RDD Name” link we can see exactly on which nodes data is being stored. This is helpful when trying to understand exactly whether or not your RDD’s are in memory or on disk. For this example I ran two quick RDD operations from the Spark Shell
val rdd1 =
sc.cassandraTable("ascii_ks","ascii_cs").map(
row => row.getString("pkey") ).cache()
// Cache tells Spark to save this rdd in memory after loading it
rdd1.count val rdd2 = sc.cassandraTable("bigint_ks","bigint_cs").map(
row => row.getString("pkey") ).cache()
rdd2.count
Cache commands indicate that spark needs to keep these RDDs in memory. This will not cause the RDD to be instantly be cached, instead it will be cached the next time it is loaded into memory.
That's all for my most frequent troubleshooting tips, hopefully we’ll be able to enhance this guide and provide even more formal documentation for Spark. Check back soon!


