Metrics in Apache Cassandra 1.2

Yuki Morishita

Apache Cassandra exposes various kind of internal metrics from client read/write request latencies to ColumnFamily's Bloom filter false positive ratio through JMX. From version 1.1, Cassandra started using Yammer's Metrics library to track new client request metrics. Cassandra 1.2 expands use of the library to other metrics that are already available and put them together into org.apache.cassandra.metrics JMX domain. For backward compatibility, metrics are still available through the same JMX location as before (in fact, nodetool is still using old interface), but those implementations are (almost) replaced by new metrics.
Motivation
So what's good about using Metrics library? Metrics library offers some fundamental tools for tracking metrics such as Counters, Gauges and Timers with ease of use API.
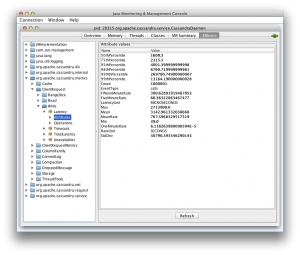
For example, to track client request read/write latency, we use Timer. You just code to start and stop Timer and it calculates all the interesting metrics we need. As you can see in the picture bellow, write latency now shows various percentiles, min, mean, max values and request rates.
Exporting metrics
One nice feature that Metrics library has is the ability to export metrics to files or other systems periodically.
There are official "metrics reporters" to export metrics to csv files, console, and external systems like Ganglia and Graphite. Also, there are community developed reporters like statsd reporter.
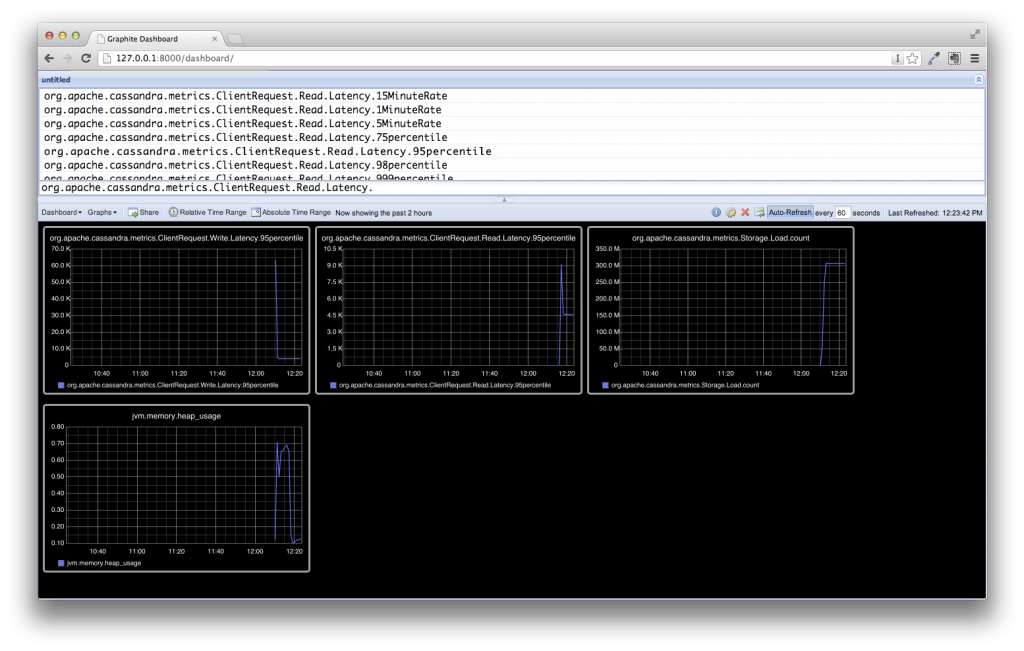
Example: Graphite integration
Let me show you quick example. Metrics reporting feature is not fully integrated into Cassandra yet (there is a ticket for this), so you need to do some coding to configure reporting.
Since we don't want to add code to Cassandra itself, we use java agent to setup metrics reporting to Graphite.
1. Get Metrics Graphite reporter jar
You need to grab metrics-graphite-2.0.3.jar and place it to $CASSANDRA_HOME/lib directory. When Cassandra starts up, it is added to classpath automatically. We also use it to compile our agent.
2. Write java code to configure GraphiteReporter
| package com.datastax.example; | |
| import java.lang.instrument.Instrumentation; | |
| import java.util.concurrent.TimeUnit; | |
| import com.yammer.metrics.reporting.GraphiteReporter; | |
| public class ReportAgent | |
| { | |
| public static void premain(String agentArgs, Instrumentation inst) | |
| { | |
| // reports metrics to Graphite at 127.0.0.1:2003, every 60 seconds | |
| GraphiteReporter.enable(60, TimeUnit.SECONDS, "127.0.0.1", 2003); | |
| } | |
| } |
view rawReportAgent.java hosted with GitHub
You also need MANIFEST.MF to run as a java agent
| Manifest-Version: 1.0 | |
| Premain-Class: com.datastax.example.ReportAgent |
view rawMANIFEST.MF hosted with GitHub
3. Package into jar
Compile the code and package into jar file. For example:
$ javac -cp $CASSANDRA_HOME/lib/metrics-core-2.0.3.jar:$CASSANDRA_HOME/lib/metrics-graphite-2.0.3.jar com/datastax/example/ReportAgent.java

$ jar -cfM reporter.jar .
4. Edit cassandra-env.sh
You need to add following line at the end of "conf/cassandra-env.sh" to load your jar as java agent.
JVM_OPTS="-javaagent:/path/to/your/reporter.jar $JVM_OPTS"
5. Start Cassandra
And voilà. Eventually you can see your Metrics through Graphite web interface.
Available metrics
There is a large number of metrics available in Cassandra so I cannot list all up in this post. Instead, you can find the list of new metrics and their brief explanations at Apache Cassandra Wiki.
Conclusion
In this article, I showed how cassandra's metrics are built using Yammer's Metrics library and example reporting using Graphite. New metrics offer much more information than previous versions, and are easily integrated to other systems.
More Company
View All

The Top 5 DataStax Stories from 2023