Big Analytics with R, Cassandra, and Hive

The R project is taking over the data world. With a plethora of algorithms at your fingertips it's not hard to see why R is such a powerful data analysis tool. I was fortunate enough to work with some of the original developers of the then S-Engine at bell labs out of college and even managed to write a few CRAN packages. In fact the ROracle package is now shipped with Oracle's big data appliance (who would have ever imagined!)
There has been a lot of work recently to integrate Hadoop with R by means of writing map/reduce in R. Most of the data scientists I've spoken to don't really want this, they really want ways to get data into R and use data sampling and other estimation techniques (for example hive sampling). This post will show how you can interact with Cassandra from R as well as with the Cassandra Hive Driver.
Reading data from Cassandra with JDBC
The prerequisites are the RJDBC module, Cassandra >= 1.0 and the Cassandra-JDBC driver. In the demo I've put the driver in the same directory as the cassandra jars.
The example code assumes you have run through the Portfolio Manager Demo that comes with DSC/DSE
| #Load RJDBC | |
| library(RJDBC) | |
| #Load in the Cassandra-JDBC diver | |
| cassdrv <- JDBC("org.apache.cassandra.cql.jdbc.CassandraDriver", | |
| list.files("/Users/jake/workspace/bdp/resources/cassandra/lib/",pattern="jar$",full.names=T)) | |
| #Connect to Cassandra node and Keyspace | |
| casscon <- dbConnect(cassdrv, "jdbc:cassandra://localhost:9160/PortfolioDemo") | |
| #Query timeseries data | |
| res <- dbGetQuery(casscon, "select * from StockHist limit 10") | |
| #Transpose | |
| tres <- t(res[2:10]) | |
| #Plot | |
| boxplot(tres,names=res$KEY,col=topo.colors(length(res$KEY))) | |
| title("BoxPlot of 10 Stock Price Histories") |
view rawgistfile1.r hosted with by GitHub
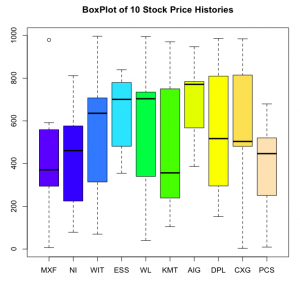
Alternately there is a new RCassandra package which looks nice too.
R, Cassandra, and Hive
For accessing Hive and Cassandra from R, I will be using DataStax Enterprise.
First, startup the hive server: dse hive --service hiveserver
| #Load RJDBC | |
| library(RJDBC) | |
| #Load Hive JDBC driver | |
| hivedrv <- JDBC("org.apache.hadoop.hive.jdbc.HiveDriver", | |
| c(list.files("/Users/jake/workspace/bdp/resources/hadoop",pattern="jar$",full.names=T), | |
| list.files("/Users/jake/workspace/bdp/resources/hive/lib",pattern="jar$",full.names=T))) | |
| #Connect to Hive service | |
| hivecon <- dbConnect(hivedrv, "jdbc:hive://localhost:10000/default") | |
| #Create Hive table mapping to Cassandra ColumnFamily | |
| tmp <- dbSendQuery(hivecon,"create external table StockHist(row_key string, column_name string, value double) | |
| STORED BY 'org.apache.hadoop.hive.cassandra.CassandraStorageHandler' | |
| WITH SERDEPROPERTIES ('cassandra.ks.name' = 'PortfolioDemo')") | |
| #Run Hive Query to get returns | |
| hres <- dbGetQuery(hivecon,"select a.row_key ticker, AVG((b.value - a.value)) ret | |
| from StockHist a JOIN StockHist b on | |
| (a.row_key = b.row_key AND date_add(a.column_name,10) = b.column_name) | |
| group by a.row_key order by ret") | |
| #Plot | |
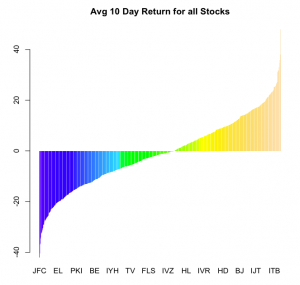
| barplot(hres[,2],names.arg=hres[,1],col = topo.colors(length(hres[,2])), border = NA) | |
| title("Avg 10 Day Return for all Stocks") |
view rawgistfile1.r hosted with by GitHub
Conclusion
I hope this post has shown how simple it is to access your Cassandra data from R, and why combining it with the hundreds of statistical methods the community has added is a powerful combination.

